The aggregate market value of the small-cap commercial real estate market has increased substantially as exceptional investment and space market fundamentals prevail.
×
![]()
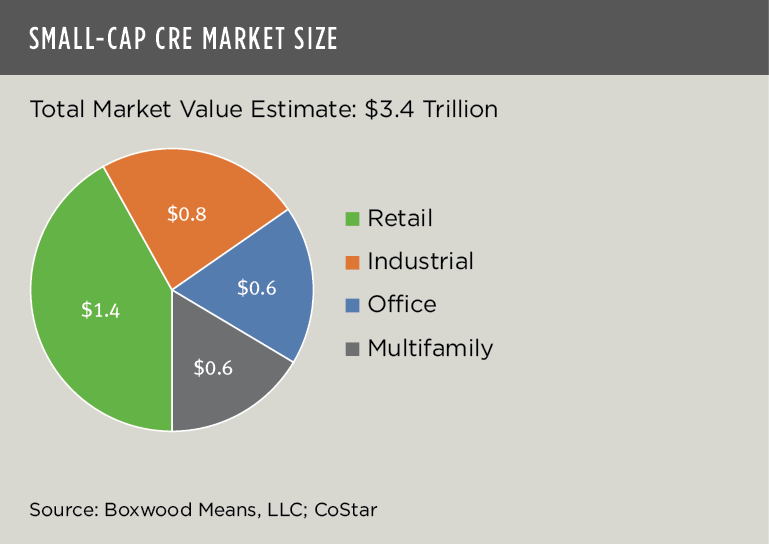
Despite the brief recession during 2020 that was compounded by prolonged market ambiguities arising from the pandemic, the size of the U.S. small-cap CRE market expanded gradually by Q1 2022 to an estimated $3.4 trillion in total dollar value according to a wholly new research study by Boxwood Means. In the analysis of market valuations for the four principal property types, Retail accounted for the largest component totaling $1.4 trillion followed by Industrial assets valued at $0.8 trillion and then Office and Multifamily roughly at $0.6 trillion each. (See the nearby graph.)
Boxwood’s valuation of the total size of the U.S. small-cap CRE market1 may represent roughly 30% of the total dollar value of CRE’s four main property sectors as a whole based on an estimate of $12 trillion by Nareit.
×
![]()
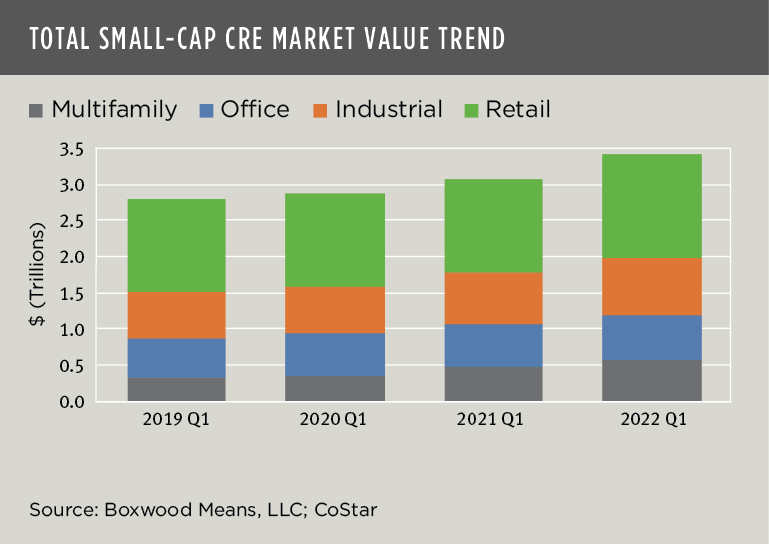
Over the past year, the total valuation of the small-cap CRE domain accelerated by nearly 10% as unprecedented double-digit growth in small commercial and multifamily asset prices tracked a resurgence in national space market fundamentals exemplified by swelling demand and historically low vacancy rates. The market’s value growth trend over time is shown in the next graph where the asset size of the Retail component is similarly dominant2.
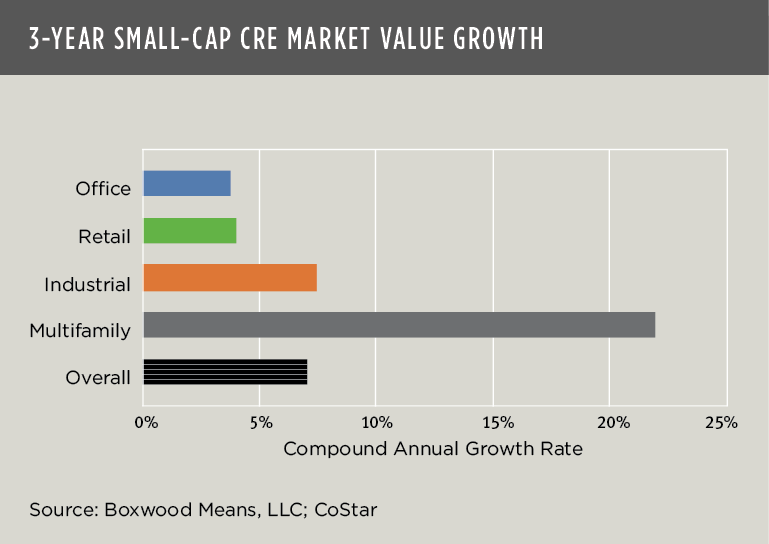
What is less apparent from this illustration – but obvious in the next – is that the Multifamily segment recorded the greatest expansion in asset size over the three-year period highlighted by an outsized compound annual growth rate (CAGR) of 21.9%. Its CAGR was nearly three times greater than the average annual rate of return for Industrial, the next best performer at 7.5%. Retail and Office followed with yields of roughly 4% each. The overall market’s CAGR was 7.1% across all four sectors3.
×
![]()
It comes as no surprise that the returns for Multifamily and Industrial assets outpaced the other two property types. After all, the small-cap Multifamily sector has advanced at a feverish pace for years with record-setting demand, habitual supply scarcity, and solid rent growth. Similarly, Industrial rents have soared, and vacancies have dwindled with a revival in U.S. manufacturing as well as with seemingly boundless demand for warehouse facilities of all sizes by logistics and e-commerce businesses.
The overall sustained growth in market asset values described here speaks to the impressive stability of the small-cap CRE domain despite some difficult economic, social, and public health conditions over the past couple of years. Naturally, this market’s resilience hinges primarily on the nation’s millions of small businesses that, by dint of their stamina, diversity, and entrepreneurial spirit, ultimately keep the U.S. economic engine moving forward. There may be some new warning signs emerging from economic reports of late, but the durability of the ecosystem linking small-cap CRE and small business is a lodestar for investors and lenders in this massive space.

 Randy Fuchs