Small-cap CRE prices have accelerated at an unprecedented rate. The rising inflation in asset values naturally raises the question: Are we in a price bubble? As far as the small-cap CRE market is concerned, the answer appears to be No.
×
![]()
Market bubbles take shape as prices rise rapidly, the consensus sentiment among investors is extremely bullish and, importantly, assets are traded with little consideration of the financials or, in our case, a disconnect from property fundamentals. This market exuberance often leads to speculative purchasing behavior that only pushes prices higher.
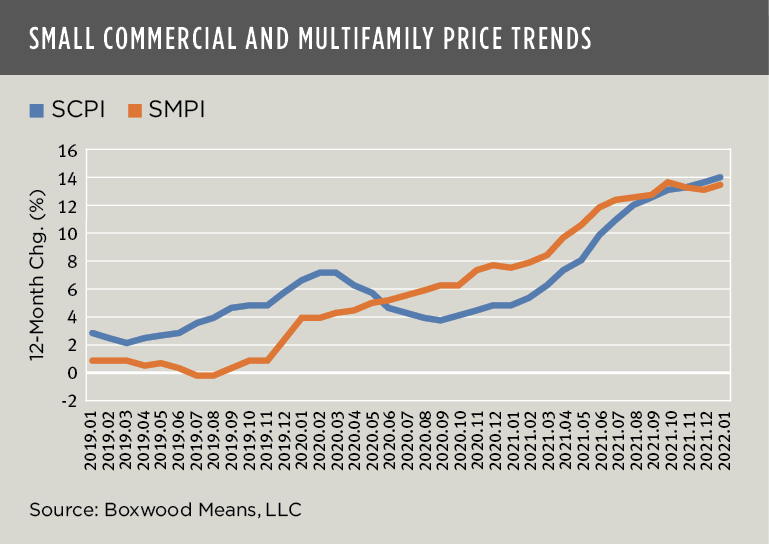
Undoubtedly, small-cap CRE property prices have rocketed. Boxwood’s National Small Commercial Price Index (SCPI) posted double-digit annual price growth for eight consecutive months as of January. This is an unprecedented streak in our historical time series dating to 2006. So is the exceptional 19.2% appreciation in asset prices since the short Covid recession began in February 2020, i.e., it’s the highest two-year leap in prices we’ve ever recorded. SCPI’s elevated trend line is shown (along with small multifamily prices) in the nearby graph.
The super-abundance of debt capital from commercial banks and nonbank lenders is certainly a factor in this vigorous price growth. Also, the prolonged era of low interest rates has played a major role.
×
![]()
Yet what may be equally, if not more determinative are the facts and signals emanating from the CRE space market. Indeed, perhaps the key question to address is to what degree have these frothy prices tracked or, on the other hand, fallen out of sync with property fundamentals.
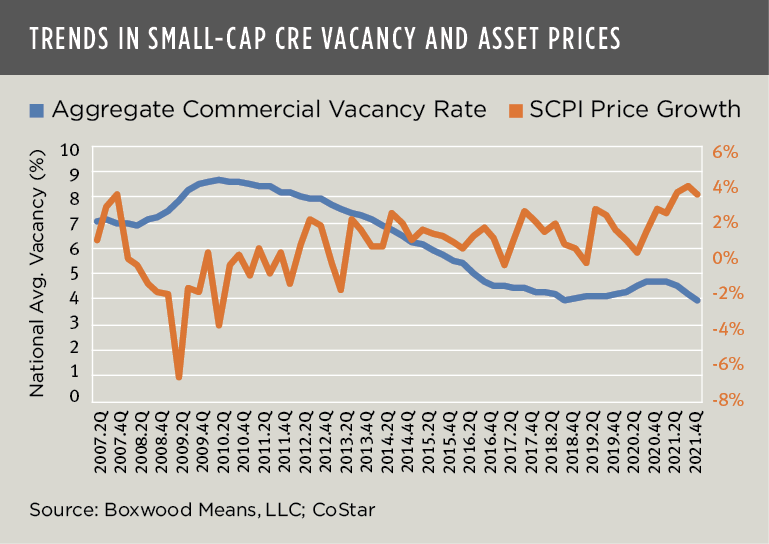
A review of recent market trends is revealing. In the nearby graph, we can see an inverse relationship between quarterly changes in SCPI prices and the aggregate national small-cap vacancy rate (across small office, industrial and retail sectors). A strong -.53 correlation between these two variables indicates that asset prices increased (most recently by a whopping 2% to nearly 4% per quarter) as vacancy rates edged down to a historic low point1. In fact, the national vacancy rate declined by a sizable 70 basis points last year as CRE leasing demand2 spiked in concert with the revitalization of small businesses and a strong rebound in the national economy.
×
![]()
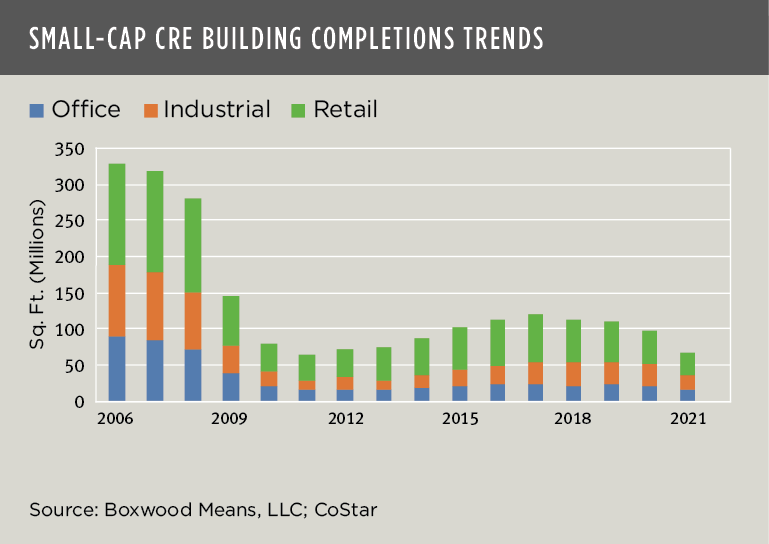
It makes some sense that knowledgeable investors might rationally bid up asset prices considering that tight space market conditions naturally bolster rent and NOI growth. But what makes this argument even more compelling is the long-standing, structural gap between small-cap CRE supply and demand since the end of the GFC. In fact, demand soared with the ensuing economic recovery3 but, as the next graph shows, the supply spigot never turned up in response.
Clearly, a rupture exists between small-cap CRE demand and inventory expansion and, with a relatively muted new construction pipeline to boot, this situation shapes up as a classic case of market disequilibrium.4
×
![]()
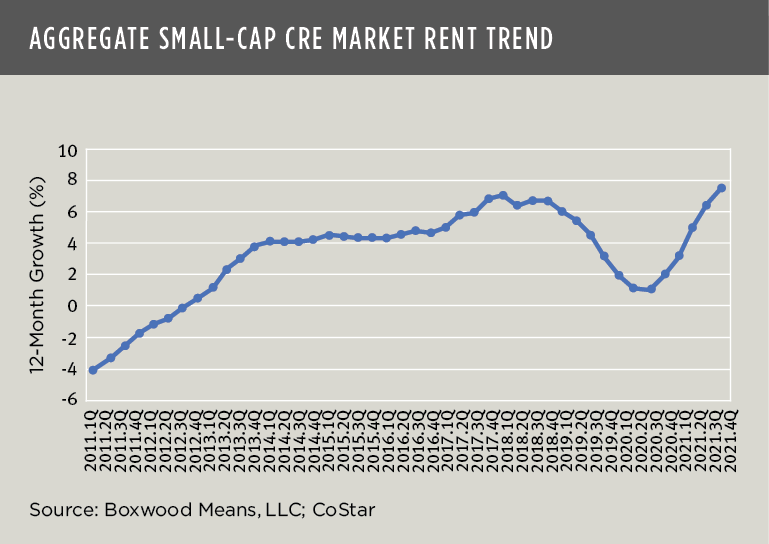
Market rents have thus soared with this wide space market disparity. According to CoStar’s aggregate of small-cap CRE office, industrial and retail rents, lease rates jumped 7.4% YOY – the highest annual growth rate since at least 2006 – and rose 9.4% since Covid’s outbreak (see the nearby graph). Such sizable rent growth might seem inconceivable considering the pandemic’s adverse impact on small businesses. However, with the assistance of the federal government’s PPP loans, many Main Street businesses avoided closure and did not abandon their tenancies5. As a result, small office, industrial and retail buildings in general have not only preserved their investment allure but also generally confer sustained upside potential for investors.
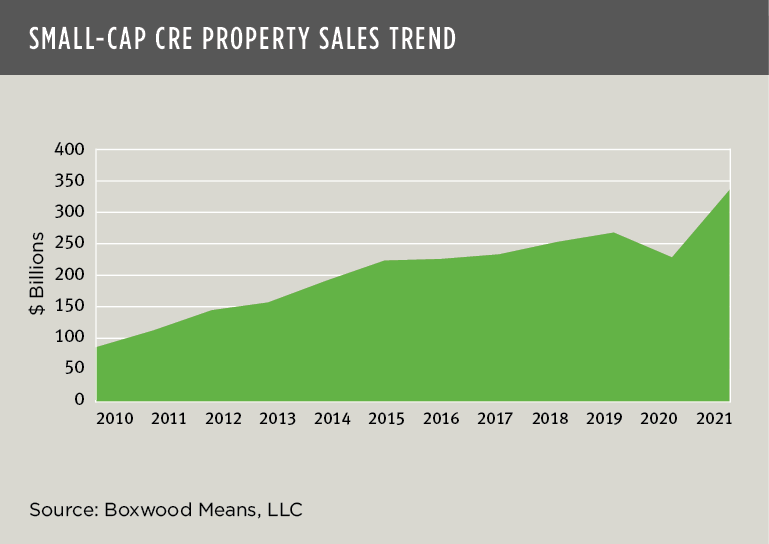
Given the strong property and capital market fundamentals, it's not surprising then that investors have rushed into the arena to acquire small-cap CRE assets. Transaction volume of $341 billion in 2021 was a record high, nearly a 50% increase over the previous year, and 25% higher than 2019 pre-pandemic according to Boxwood’s research. (See the nearby graph.) No doubt the receipts of this outsized sales activity was even more pressure on asset prices.
×
![]()
Of course, numerous direct and indirect variables have a bearing on asset prices. So, it’s a stretch to try and rest causality on any one factor alone. That said, prolonged, structural scarcity of small commercial facilities is an under-appreciated and key driver behind escalating small-cap CRE prices.
In sum, the record runup in prices is not caused by blatant disregard for appropriate asset values, nor is it speculative buying untethered from market reality. In fact, these small-cap CRE market trends appear to be telling us quite the opposite: Prices are rationally tracking fundamentals, and Bubbleville is nowhere in sight.

 Randy Fuchs