The aggregate market value of U.S. small commercial real estate assets rose steadily at midyear despite the increasingly uncertain outlook for CRE prices and the economy at large.
×
![]()
The total dollar value of the small-cap CRE market has scaled to peak levels as asset prices have registered continuous gains since Covid first rattled the economy more than 18 months ago. Yet, rising interest rates and faltering investor sentiment have now begun to curtail growth in property prices in both small- and large-cap CRE domains.
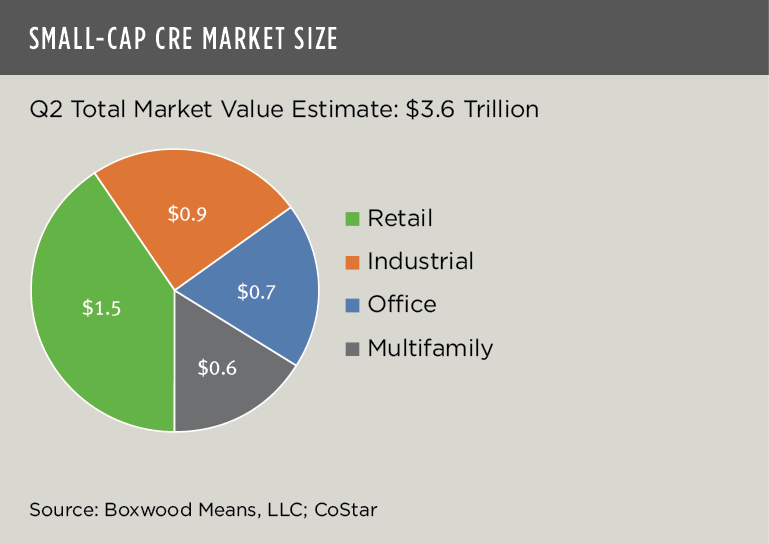
However, to date strong fundamentals have underwritten the latest advance in the total dollar value of small-cap CRE. Boxwood Means’ research shows that the estimated total market value expanded by a sizable 9.1%, or $300 billion, to $3.6 trillion in Q2 across the four principal property types1. This total represented vigorous 19.1% growth YOY. As illustrated in the first graph, the general retail sector continued to generate the greatest total market value estimated at $1.5 trillion resulting from its relatively high average transaction sales prices coupled with buildings totaling nearly 8.0 billion sq. ft2. Industrial assets, with an even larger national inventory of 8.4 billion sq. ft. and lower average sales prices, claimed the second highest individual market value at $0.9 trillion followed by office and multifamily sectors, at $0.7 trillion and $0.6 trillion, respectively.
×
![]()
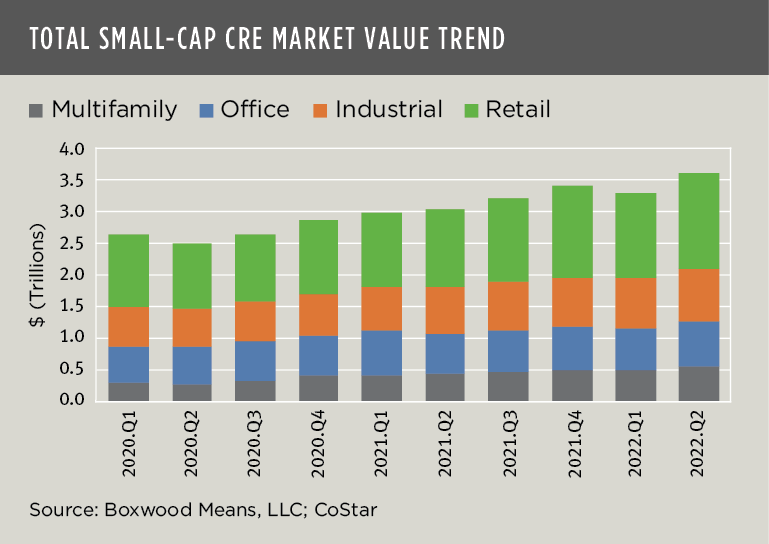
After the brief Covid-related recession, asset prices recovered swiftly in 2020 and drove a remarkable 46% increase in the market’s aggregate dollar value since that time. As the market size has appreciated to this new total value, the market valuation changes of the four property sectors have remained relatively consistent over the recent past (see the next graph).
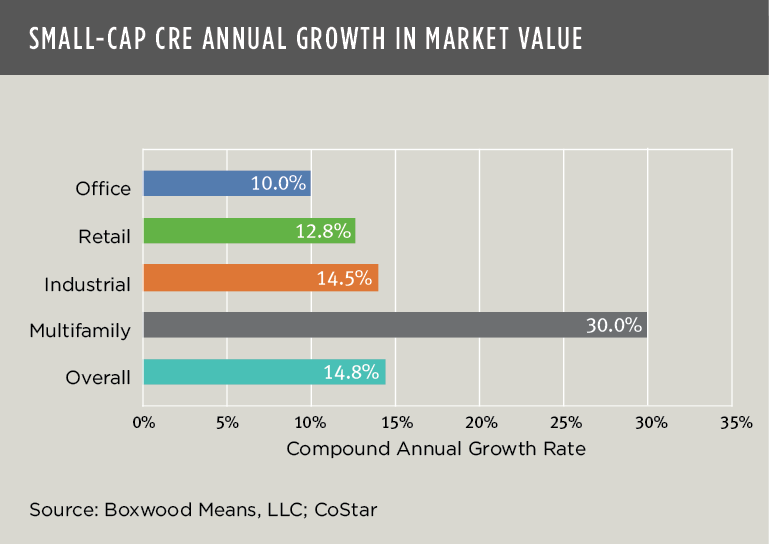
From an investor’s perspective, though, a better way to understand and evaluate how the components of the small-cap CRE market have performed over time is to use the compound annual growth rate (CAGR). As shown in the final graph, there are marked differences in the rates of return over the past two years. In the aggregate, the small-cap CRE market has grown at a healthy 14.8% annualized clip. Unsurprisingly, the multifamily sector was the top performer with an outsized CAGR of 30.0%, more than double the rate of return for industrial that followed at 14.5%. These two property types were trailed by retail (12.8%) and office (10.0%). The higher returns to multifamily and industrial largely track with investors’ recent sector preferences and favorable space market fundamentals where demand consistently outstrips supply.
×
![]()
While a regime change with broad-based repricing of CRE assets might emerge as a result of additional interest rate increases (and higher resulting debt costs), the degree to which property valuations decline will of course depend on a slew of factors beginning with geographical market and property type. What will help small-cap investment income properties weather a potential storm is the cushion provided by historically low commercial vacancy rates. Also, the conventional use of short-term leases that allow for quicker rent adjustments as leases expire can insulate small CRE property owners from some of the downside risk of inflation and interest rate hikes3.
Even if a pullback in asset prices is inevitable later this year, the massive trillion-dollar, small-cap CRE market will continue to be a beacon of long-term opportunity for small-balance lenders, debt funds, and property investors among other industry participants.

 Randy Fuchs