News of a looming catastrophe for commercial real estate has recently spread like wildfire among the industry press. While there is plenty of evidence that interest rate hikes have pinched CRE deal activity and shaken asset prices thereby elevating risks of some maturity defaults, reports of an impending cataclysm appear to be overdone especially when it comes to the outlook for small-cap CRE.
A recent research note from Morgan Stanley reflects the growing fever storm over a CRE crisis. The report projects a 40% drop from peak CRE valuations because “commercial real estate, already facing headwinds from a shift to hybrid/remote work, has to refinance more than half of its mortgage debt in the next two years.”1
Similarly, in a separate report KBW expects CRE peak-to-trough declines of as much as 30% when higher cap rates and rent changes are considered.2
You can bet that some subset of borrowers with troubled properties will, at loan maturity, face interest rate sticker shock and struggle to refinance if asset prices plunge as much as these sources suggest. And granted there is precedence here with the 30%-40% drop from peak valuations that occurred during the GFC.3
×
![]()
However, let’s be clear: the current expectations for price declines in both of the above reports – as well as the price collapse witnessed during the GFC – suffer from a heavy institutional bias. That is, these reports primarily focus on the price performance of institutional-quality or large-cap CRE assets derived from indices like NCREIF, Green Street Advisors, and MSCI/Real Capital Analytics. On the other hand, price trends within the massive private real estate equity market of assets under $5 million, recently estimated by Boxwood at $3.5 trillion, have traditionally been overlooked – or presumed by analysts to track closely with larger assets.
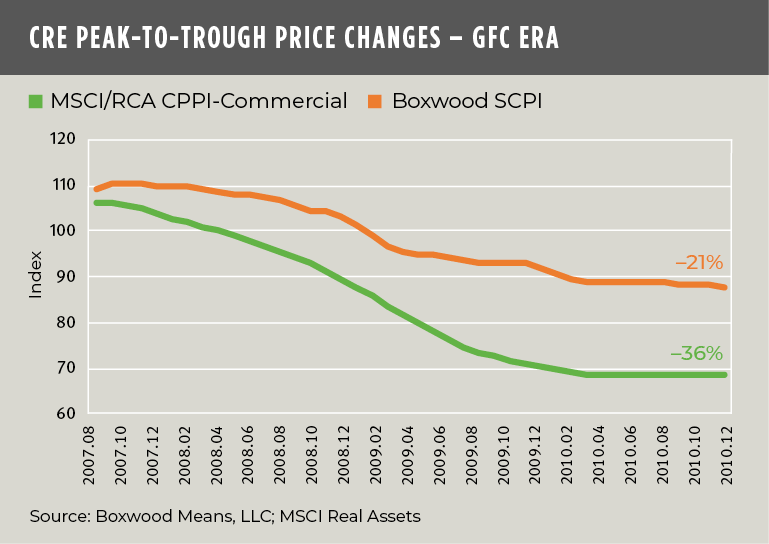
Well, the fact is that these two domains may follow a similar trajectory, but the distance that each travelled during the GFC era was clearly not equivalent. As the first graph shows, large-cap CRE prices plummeted 36% peak-to-trough while small-cap prices fell by only 21%.
This sizable performance gap is noteworthy and is especially relevant to lenders and investors in the small-cap CRE arena where a reliable and appropriate historical yardstick with which to estimate downside risk in today’s fragile environment tends to be wanting.
×
![]()
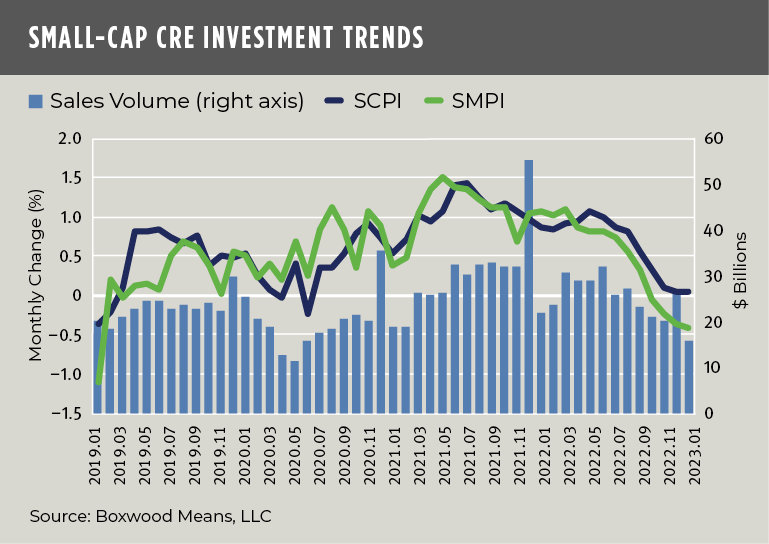
However, small-cap CRE lenders and investors might still take note: Our second graph shows that small-cap CRE prices were faltering through January, though not at an alarming rate, as transaction volume fell 29% YOY to just $16 billion. Annual increases in small commercial property prices (SCPI) decelerated for the eighth consecutive month to 7.8% representing the lowest YOY return since mid-2021. Moreover, a prospective view is somewhat more sobering: i.e., prices were flat for the third month in a row, and SCPI’s annualized rate of return on a go-forward basis is a mere 0.5%.
Small-cap multifamily (SMPI) prices fared a bit worse, easing 0.4% in each of the last two months and a full percentage point over three. SMPI’s annual return has dropped rapidly of late – still positive at 5.3% – but down from a hefty 14.3% in January 2022. A projection of January’s price change pegs SMPI’s annualized growth at a negative 4.8%.
Still, this small-cap CRE price performance suggests that the small commercial/multifamily property markets are relatively more resilient than the institutional CRE domain. This posture derives support from small-cap CRE occupier trends which, through December of last year, proved to be on relatively firmer ground, exemplified by sector vacancy rates that still hovered near historic low levels.
Moreover, regarding large-cap CRE price trends, the contrast couldn’t be starker. MSCI/Real Capital Analytics cited that, as February’s total investment volume for principally larger assets shed a whopping 51% over 12 months, the month-over-month return for the RCA CPPI National Index dropped a hefty 2.2% including a negative 6.9% return YOY. Even more telling was Green Street’s March report that CRE prices for institutionally oriented properties plunged 15.2% from 12 months earlier. These stated price contractions arise in part from the mounting distress among office towers.
I can appreciate that these differing price trends and reports may provoke more dissension than agreement among readers when it comes to the outlook for CRE. Clearly, there are headwinds ahead. But my reading of the market data suggests that, however counterintuitive, there is less downside – and more manageable – risk to collateral values for small-cap properties generally going forward than among their larger counterparts.

 Randy Fuchs