Despite unfavorable winds and serious waves of doubt, the small-cap CRE market found safe, if not temporary safe harbor at year’s end.
Strong occupier fundamentals, the lynchpin to profitable lending and investing for income-producing properties, were diminished as the year wore on, as high inflation and interest rate hikes crimped commercial leasing activity as well as property investments.
Even so, the small-cap CRE space market persevered. Highlights of Boxwood’s analysis of Q4 CoStar data on office, industrial and retail properties of less than 50,000 sq. ft. include:
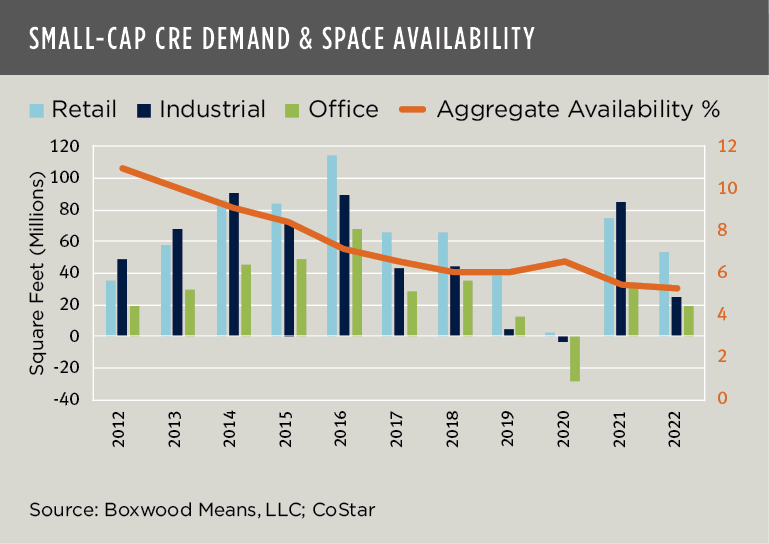
Demand for commercial space ebbed.Though national small-cap CRE leasing demand rose 15% quarter over quarter, the velocity of the market’s expansion slowed considerably. Total annual net absorption of 98 million sq. ft. across the three property types represented a decrease of nearly 50% compared with 2021 and was among the smallest annual occupancy gains in a dozen years. (See the nearby graph.)
×
![]()
All three property sectors posted modest advances in occupancies for the quarter and year. Rebounding by 10% compared with Q3 demand, small-cap retail accounted for more than one-half of the year’s aggregate net absorption (53 million sq. ft.) as neighborhood strip centers and the like continued to prove their relevance and value in service of the everyday shopping needs of local residents. Nevertheless, that sum came up 28% short of this sector’s total demand in 2021. Similarly, though office demand jumped by 41% in Q4 (from a piddling base amount in Q3), the full-year total of 19 million sq. ft. was nearly 35% below the amount in the previous year. Finally, and perhaps most surprisingly given its obvious fondness among investors and users, the industrial sector disappointed. Granted, leasing requirements for small warehouses, flex facilities, light industrial properties, etc., increased by 12% in Q4. But a longer view suggests a more problematic situation: e.g., last year’s positive net absorption of 25 million sq. ft. was a whopping 70% less than 2021 and the lowest annual total in 12 years (when excluding the pandemic-related years between 2019-2020). U.S. economic trends might partially explain this industrial slowdown: e.g., the Institute of Supply Management recently reported a continued contraction of new orders and production in their December manufacturing report.
National vacancy statistics hovered at record lows. Despite the small yearly gains in commercial occupancies, prevailing vacancy metrics offer solid evidence that the small-cap CRE space markets are fundamentally sound and battle ready (e.g., think recession). The aggregate national average vacancy rate ticked down 10 bps to 3.9% in Q4, nearly 200 bps below the average for a span of a dozen years and, compellingly, a sizable 500 bps below its apex following the last great recession.
Yet, what is more insightful here is the availability rate that, by combining physically vacant space with sublease square footage and other marketable tenant space (e.g., rented units with near-term expiring leases), offers analysts a more reliable and inclusive portrait of market “vacancy.” (See again the trend line in the first graph.)
And that picture only further substantiates the firm ground on which the small-cap CRE markets stood at year end. Granted, sublet space, which we might expect to rise with growing economic uncertainties, did in fact increase by 6% in the quarter and 16% YOY to roughly 45 million sq. ft. across all sectors. But this YOY increase of three million sq. ft. hardly impacted the national availability rate which benefited from both a modest, inconsequential level of total new building deliveries (new supply) and the aforementioned slight uptick in leasing demand. At year end, then, the aggregate national availability rate stood at 5.3%, within 10 bps of its record nadir posted at mid-year.
Incidentally, availability rates for each property sector were at or near rock bottom in December. An invigorated small-cap retail sector posted a record-setting low of 4.5%, down a notable 40 bps from 12-months earlier, while the availability rate for the often-maligned office sector declined 20 bps YOY to 8.4%. On the other hand, the industrial availability index moved up a bit, increasing 20 bps above its mid-year record low to 4.2% due to weaker positive net absorption combined with higher-than-average building deliveries.
×
![]()
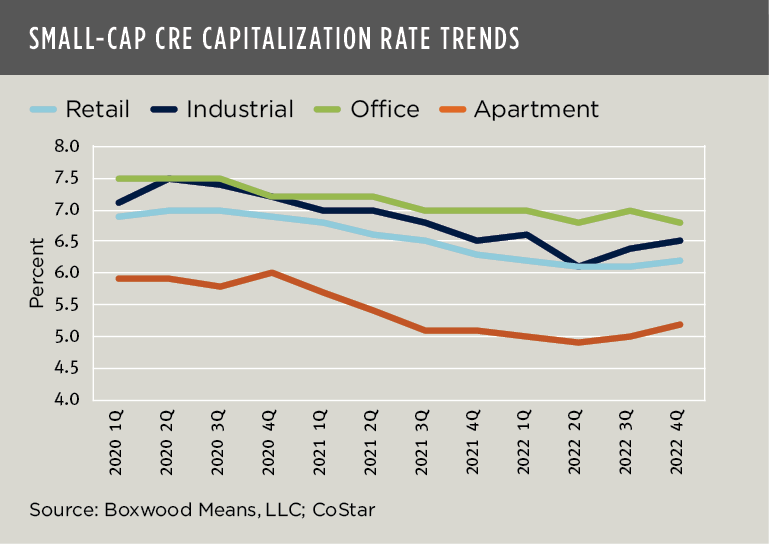
Cap rates inched up. While occupier fundamentals were relatively steadfast last year, investor sensitivities to elevated interest rates and inflation have soured small-cap CRE deal-making and trends. Asset prices are increasingly under pressure as many transactions fail to close, and buyers and sellers disagree on market-driven valuations. As a result of these riskier conditions, cap rates edged up (see the nearby graph.) The Q4 capitalization rate for retail properties bumped up 30 bps to 6.0% from the previous quarter when it attained its lowest point over the last three years according to CoStar. Similarly, the multifamily cap rate rose 20 bps for the second consecutive period to an average of 5.2%, modestly higher than the 4.9% rate established as a three-year low during Q2. Industrial cap rates also rose for a second quarter in a row to 6.5%, up 10 bps and 40 bps higher than a recent floor reached at mid-year. Lastly, the office sector defied conventional wisdom with a 20-bps dip to 6.8%, matching its lowest cap rate in the three-year span.
We can expect that asset prices will drift lower with further increases in cap rates. Apropos, separate Boxwood research has documented last year’s slowdown in the growth of the domain’s aggregate dollar market value. While interest rates and the capital markets will largely dictate the trajectory of small-cap CRE asset prices in the near term, the occupier market’s historically low vacancy rates will likely serve as a counterweight to some degree against potential, significant losses in asset values.

 Randy Fuchs