×
![]()
Bloodletting in the small-cap CRE space markets mounted during Q3 as the pandemic’s tenacity stalled an extensive economic recovery, caused more small businesses to teeter or fail, and further deterred legions of professional office workers from journeying to their former workplaces. Despite the implosion in occupancies that recalls conditions during 2009, a high degree of perceived leasing churn points to a latent recovery.
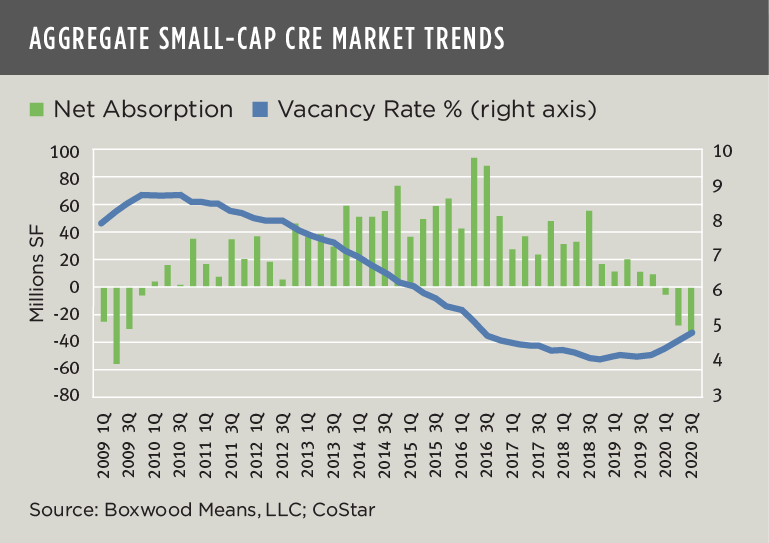
The severity of overall occupancy losses cannot be understated. Indeed, the corrosive effect of the pandemic on leasing demand rivals the sums of negative net absorption produced by the Great Recession. Small-cap occupancies across office, industrial and retail sectors contracted by a whopping 33 million sq. ft. during last quarter – the largest amount in 44 previous quarters – while aggregate YTD losses of 67 million sq. ft. extinguished total occupancy gains over the previous five quarters dating to Q4 2018. As the nearby graph shows, with reduced leasing demand the combined national vacancy rate curved upward by 20 basis points to 4.8%.
Nearly the last two years’ worth of small-cap CRE space market growth was wiped out over the preceding seven months.
"Nearly the last two years’ worth of small-cap CRE space market growth was wiped out over the preceding seven months."
Takeaways from CoStar Q3 data solely involving commercial properties under 50,000 sq. ft. include:
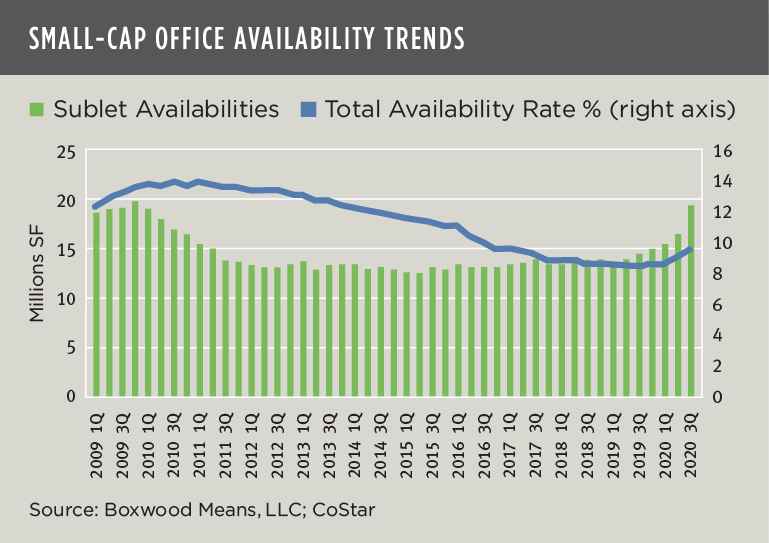
- The office sector is really struggling. Office buildings accounted for one-half of the quarter’s aggregate negative net absorption, or 16 million sq. ft., as employer commitments to the work from home movement lengthened. Increasingly, large and small businesses alike have postponed or shelved return-to-work strategies for the foreseeable future. As a result, new leasing activity was muted, and office availabilities soared. Total office availabilities rose by a sizable 50 basis points (bps) in the quarter and 110 bps YOY to 9.5% as sublet availabilities jumped to 19 million sq. ft. – notably to the highest level since late 2009 (see the second graph).
- Small-cap industrial faltered but has a heartbeat. While rising online shopping fuels ever-expanding and super-sized warehouse demand by giant e-commerce and logistics firms (see, e.g., C&W’s Q3 research report), leasing activity among small occupiers is floundering. Occupancy losses for small manufacturing, light industrial and flex users totaled seven million sq. ft. during Q3 and extended the deficit to three consecutive quarters – the first such occurrence since 2009. Net negative absorption of 25 million sq. ft. YTD reversed the occupancy gains over the preceding eight quarters. That said, improvements in international trade, energy, and machinery among other industries has pumped new life into many small industrial-based businesses. In fact, direct leasing activity rebounded close to its long-term quarterly average. Net-net, the national industrial vacancy and availability rates both rose by just 10 bps to yet historically low rates of 3.8% and 5.7%, respectively.
- Churn in the retail sector had its positives and negatives. Granted, leasing activity in the general retail category that includes strip centers, street retail and free-standing retail has taken a solid hit so far this year. The 15 million sq. ft. of net negative absorption accumulated over the past two quarters was severe, and a big anomaly for this sector: over the past 15 years there has been only one other instance (2009) where net absorption turned negative for two quarters in a row. Yet this diverse property sector is extremely resilient and tends to sprout new enterprises like mushrooms after a rain. New leases for direct space jumped 43% while sublet activity was stable. With these shifts, the retail vacancy rate increased by 20 bps to a miserly 4.6% while the availability rate inched up to a similarly muted 6.2%.
×
![]()
On its face, these Q3 national numbers do little to inspire lenders and investors in small-cap CRE. (See Boxwood’s recent report on small-cap CRE price trends here.) In its starkest terms, the recent churn activity reflects the casualties and dislocations of many Main Street businesses due to the pandemic. But Q3’s fitful leasing conditions also signal the potential vitality and reinvention of many other small businesses, raising hopes for a more rapid economic recovery especially if we can pull together and prevent further spread of the coronavirus through basic health and safety measures.

 Randy Fuchs