An onslaught of news on plummeting commercial real estate property prices has helped shape the perception, if not expectation of an impending wave of distressed assets and defaults as large tranches of commercial mortgages come due in this extended, high interest-rate era. But what if most of this negative news and data were skewed to one segment of the CRE market and not the market at large? In other words, are we overgeneralizing the extent of future turmoil because of undue attention paid to principally large, high dollar-value properties many of which are troubled?
×
![]()
As far as the U.S. CMBS market goes, the evidence of distress is mounting. The overall CMBS delinquency rate rose a sizable 51 bps in July and 135 bps YOY to 4.41%, the highest level since December 2021 according to Trepp1. Against this backdrop of worsening CMBS performance is Trepp’s estimated snapshot of $162 billion of potentially distressed assets at mid-year with an impending wave of maturities totaling $232 billion landing over the next 18 months.
Some deep-pocketed, opportunistic players including TPG, Starwood, and Brookfield are surveying the potential wreckage among refinance-challenged, maturing large CMBS loans like vultures circling roadkill. Meanwhile, their plans gain further incentive and support from CRE industry price trends that have exposed a significant, ongoing CRE market correction.
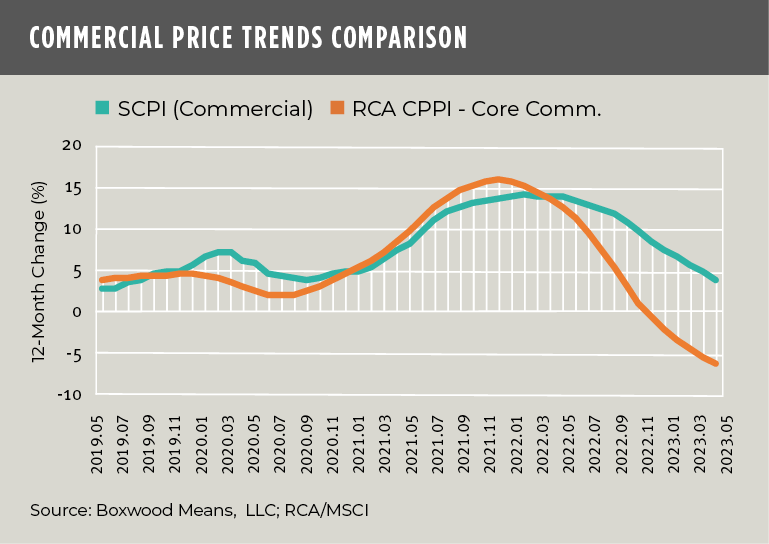
For example, Greenstreet reported that its all-property price index (CPPI) that places more weight on institutional-quality assets declined 14.2% YOY in May and by a greater degree since an early 2022 peak. CoStar indicated that its value-weighted U.S. Composite Index likewise tilted towards high-value trades dropped 8.5% in the same 12-month period and more so from its apex last summer. In addition, RCA/MSCI’s All-Property CPPI that tracks investment-grade assets above $2.5 million, decreased 10.2% YOY through May based on our analysis2.
×
![]()
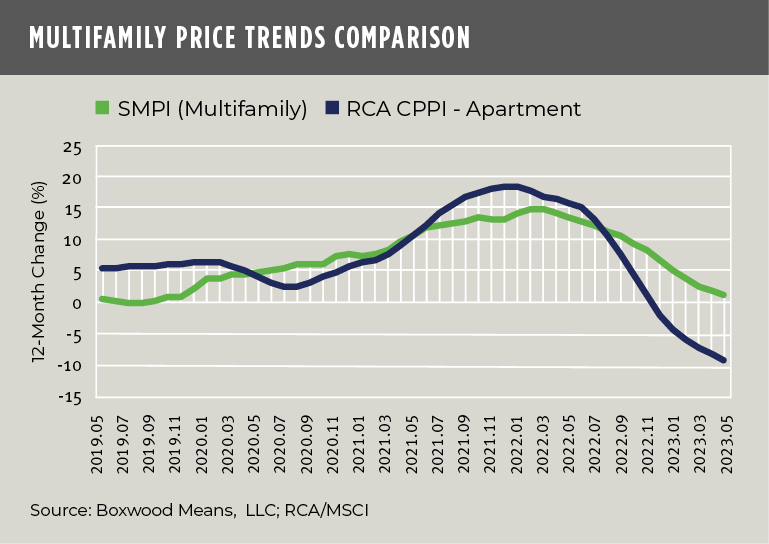
But here’s the rub. Despite low deal volume, Boxwood’s Small Commercial Price Index (SCPI) and Small Multifamily Price Index (SMPI) have continued to deliver positive, albeit modest results through May: SCPI delivered a 3.8% increase YOY and SMPI an annual return of 1.2%. Granted, SCPI has been relatively flat for seven consecutive months and SMPI over the past three. Plus, the annual price change for both sector indices has steadily declined for more than 12 months in a row. Even so, the contrasts between the domains couldn’t be starker. As illustrated by the sharply diverging trend lines in the two nearby graphs, small commercial and multifamily prices have substantially outperformed investment grade, large-cap properties over the past year. Indeed, we see spreads of 10% and 10.5% in annual returns over 12 months for the small commercial and multifamily sectors, respectively, with small caps also producing less than half the price volatility.3
What this tells us again is that in times of financial and market dislocations, small cap CRE investments offer shelter from the storm. This relative safe haven derives in part from exceptionally durable occupier fundamentals. But also, it owes its resilience to the traditional buying behavior and intentions of small, private investors who may purchase their CRE assets all cash or otherwise amortize their loans, tend to hold investments long term, and/or be an owner-user among other attributes.
At the end of the day, the smaller domain may generally track the bigger one over time, but the highs and lows – and the investment risk – tend to be largely mitigated and diminished. Moreover, when you consider the small cap CRE domain accounts for an estimated 55% of the total RBA across office, industrial and retail properties nationwide, the ominous CRE market outlook that presages so much systemic carnage for commercial properties suddenly seems less dreadful, predictable, or widespread.

 Randy Fuchs