The total market dollar value of small-cap CRE rose marginally in 2022 headlined by a shift in opportunity and risk for investors and lenders. Though the market’s total equity valuation in December testifies to this domain’s inherent resilience, sinking deal volume, decelerating prices, and rising cap rates over the second half of the year curbed the market’s considerable expansion following the Covid-19 pandemic.
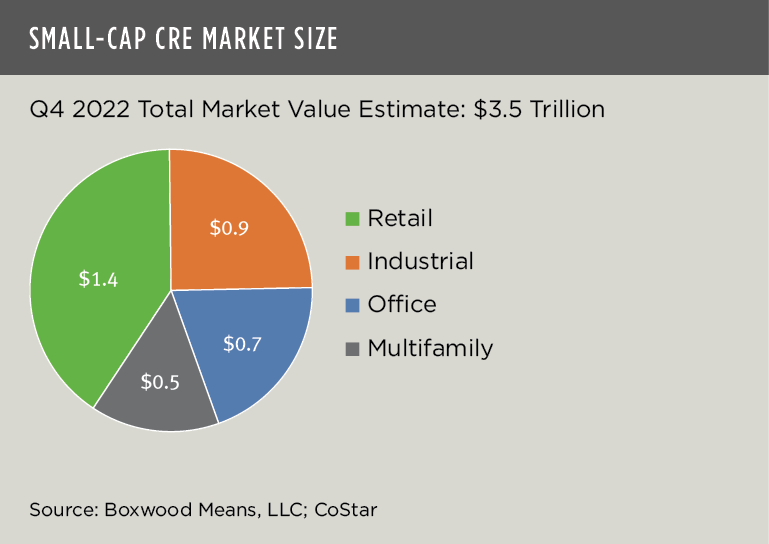
Total equity market value increased by a modest 1.9% or roughly $65 billion YOY to an estimated $3.5 trillion according to research by Boxwood Means. Among the four principal property types, the fundamentally strong industrial sector outperformed with an 8.3% gain in dollar market value followed by the supply-challenged multifamily sector with an increase of 1.4%. Valuation estimates for office (0.4%) and retail (-0.8%) were relatively flat over the previous 12 months1.
×
![]()
Sector shares of the total equity market pie at year end are shown in the nearby graph.
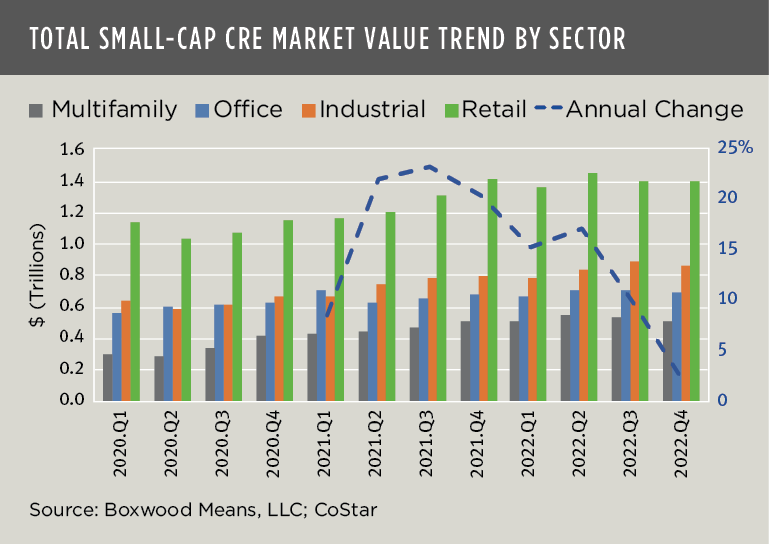
Despite the relatively flat growth during 2020, it’s noteworthy that the total dollar value of small commercial and multifamily properties soared 40.1% since the economic shock wave of the pandemic in mid-2020, and thereafter characterized by a resurgence in deal volume and double-digit growth in asset prices.
That being said, this outsized, post-pandemic market expansion has masked a clear-cut slowdown in the market’s recent annual rate of growth (see the hyphenated blue line on the nearby graph). That is, while the market’s overall dollar valuation has edged upwards, the positive rate of change in total equity valuation has steadily declined from a peak of 23.4% in Q3 2021 to the modest, aforementioned 1.9%.
This downtrend comes as Q4 sales transaction volume has plunged and gains in property prices have slowed. Also, our analysis of CoStar data indicates that CRE values will be increasingly pressured as cap rates creep up in reaction to interest rate hikes. Evidence of this trend has already emerged: Q4 cap rates rose for three of the four small-cap sectors, most prominently with retail’s 30 basis-point (bp) rise to 6.0%, along with a bump of 20 bps for multifamily (5.2%), 10 for industrial (6.5%), and a (surprising) drop of 20 bps for the office sector (6.8%).
×
![]()
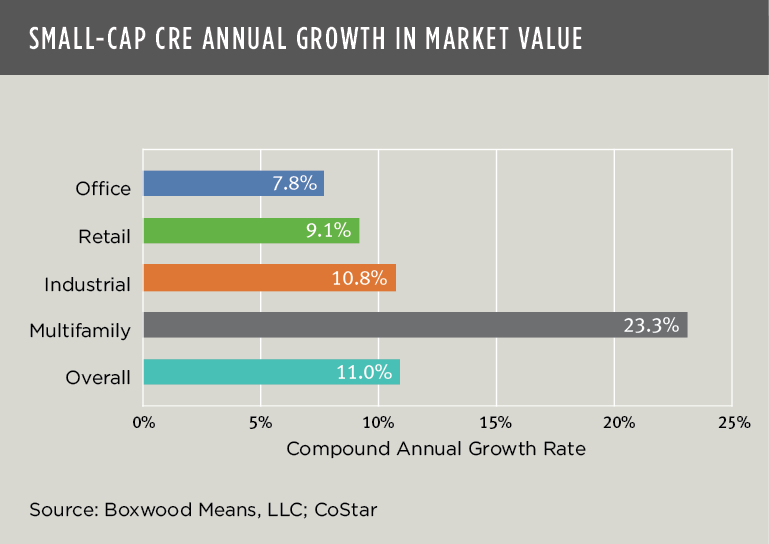
As a result of the market’s retreat, annualized investment returns have diminished over the nearly three-year time horizon examined here. As shown in the last graph, the overall or aggregate compound annual growth rate (CAGR) for small-cap CRE over the past 11 quarters has narrowed to 11.0% (from 14.0% in Q3). Each of the property sectors posted declines compared with the previous quarter, but let’s not lose sight of the fact that the domain’s annualized returns are still very attractive to real estate investors when considering the massive upheaval created by the pandemic as well as the impact of the recent market downturn. At year end, the multifamily sector ranked best with a formidable 23.3% CAGR followed by industrial (10.3%), retail (9.1%), and office (7.8%)2.
×
![]()
Notwithstanding this latest ‘normalization’ of returns, the small-cap CRE investment performance turns out to be even more enviable when compared against other asset class benchmarks such as the yield from the public equity markets. For example, the annualized return (without dividends) of the S&P 500 was just 7.9% over the last three years.
Given the market’s current headwinds principally animated by high inflation and interest rates, we might expect further ambiguity about, if not decreasing property valuations this year. But temper that sobering idea with some relatively fresh and reassuring news about small-cap CRE space market fundamentals that, in the interim, may boost the confidence of lenders and investors alike. That is, our preliminary reading of Boxwood’s extract of CoStar’s Q4 small-cap CRE occupier data across office, industrial and retail sectors shows a slight uptick in aggregate demand (i.e., net positive absorption) compared with the previous quarter, a trivial amount of new sublet space brought to US markets, and a stubborn, still historically low overall national vacancy rate.
My hunch is that small-cap CRE market, buoyed as always by a determined small business sector that displayed great fortitude and resilience most recently during and after the pandemic, will likely dodge any significant distress and long-lasting erosion in operating fundamentals or property values this year.

 Randy Fuchs