Summary
It's a market paradox: while transaction liquidity has returned to the commercial real estate market and capitalization rates have stabilized, growth in asset prices is facing serious headwinds. Normally at this juncture, we would expect to see corresponding price appreciation. Tracking across more than 100 metro areas, Boxwood's Small Commercial Price Index (SCPI) and Small Multifamily Price Index (SMPI) indicate that price growth has cooled to near six-year lows as of Q1 2026. In this research brief, we assess the cyclical trajectory of small-cap properties, corroborate our findings in a broader CRE context, and explore the macroeconomic forces flattening price gains.
Trajectory of SCPI and SMPI
×
![]()
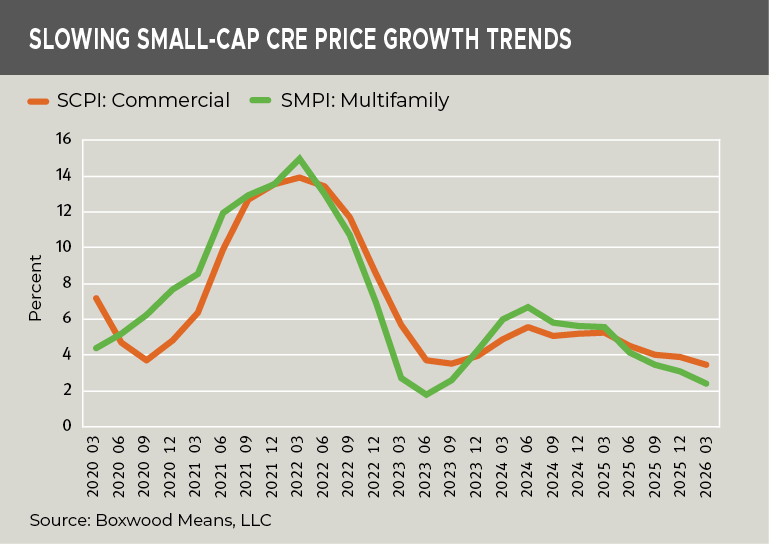
Analysis of the quarterly output illustrated in the nearby graph shows a clear double-dip deceleration in growth. After reaching period highs in March 2022 post-covid, both sectors steeply corrected through 2023. A subsequent, brief mini rebound crested in June 2024, lifting SCPI and SMPI annual growth rates to 5.6% and 6.7% respectively. However, that upward momentum fizzled as investors realized that additional interest rate relief would not be forthcoming.
Since mid-2024, both performance indices have registered a continuous, quarter-over-quarter slide. By March 2026, SCPI growth dropped to 3.5%, matching its prior cyclical low from late 2023. Meanwhile, SMPI progress narrowed to 2.4%, marking its second-lowest quarterly pace in the current six-year time frame.
Though sales volume has picked up as bid-ask spreads have tightened, this improved liquidity is largely decoupled from price appreciation, which is now capped by various market constraints (see below). In an earlier, complementary research piece, we described the repricing trends across the four principal property types as of the end of 2025.
Consistency across CRE Domains
Though other CRE price indices typically skew toward institutional-grade and larger asset transactions, the broader market patterns published by MSCI Real Capital Analytics (RCA) strongly corroborate this low-growth reality. RCA's Commercial Property Price Index (CPPI) exhibits the parallel trend: transaction-based pricing momentum across major asset types has leveled out significantly, reflecting uneven, tepid changes averaging 1.1% YOY in the aggregate through April across all major property types. This slowdown reflects the symmetry of a current valuation ceiling across institutional and small-cap CRE domains.
Core Drivers of Decelerating Growth
There are a couple of factors at the heart of the slowing growth rate in small commercial and multifamily prices including:
-
The 10-Year Treasury Yield: Financing costs remain elevated as the 10-year Treasury hovers persistently in the mid-4% range. Because small commercial and multifamily loans are tethered to this benchmark, debt remains expensive. Investors and lenders are underwriting deals with tight limits on cap rate compression that directly affects purchase pricing potential.
-
Expense-Driven NOI Compression: Property income faces strong pressure from non-interest operating expenses. Double-digit spikes in commercial insurance premiums, escalating property tax assessments, and inflation-sticky labor and maintenance costs are eroding NOI. Naturally, stagnant net income deters higher asset valuations.
-
Small Asset Vulnerability: Small-cap CRE operators frequently lack the corporate capital cushions, flexible hedging arrangements, or diverse credit lines possessed by institutional investors. As low-coupon, pandemic-era debt reaches maturity, refinancing at prevailing market rates creates substantial cash flow constraints. This dynamic forces motivated sellers to execute trades typically at lower market values.
Implications for Lenders
Boxwood's latest pricing trends underscore a shifting risk landscape for lenders and portfolio managers who, in today's normalized transaction market, must contend with relatively flat valuations for small-balance debt. For institutional and private lenders underwriting small-balance loans or navigating the refinancing wave, lackluster property prices demands a pivot in credit and risk strategies:
-
The End of the "Valuation Bailout": With annual price growth flattening in the 2.0% - 3.5% range, lenders can no longer count on sizable market appreciation to reduce LTV ratios over the life of the loan. Because collateral values are growing at their slowest pace in six years, initial underwriting margins will remain thin and do not leave much room for error if the asset underperforms.
-
Stronger DSCR Stress-Testing: Because heightened expense inflation is actively compressing NOI, historical cash flows are no longer a safe baseline bet. DSCR calculations must be heavily stress-tested for continued growth in non-interest expenses rather than assuming stable profit margins, so as to ensure the property has the cash cushion to absorb increasing operating costs.
-
Navigating the Maturity Wall Shortfall: As low-coupon, pandemic-era debt reaches maturity, refinancing these assets into today's mid-4% Treasury environment will trigger immediate debt-sizing shortfalls for smaller borrowers. Because current cash flows frequently cannot support a straight dollar-for-dollar loan replacement at higher interest rates, lenders must proactively prepare for a surge in "cash-in" refinancings and structural modifications to prevent technical defaults.
The bottom line appears to be that until long-term interest rates drop or operating margins normalize, small commercial and multifamily price gains will likely remain constrained.

 Randy Fuchs