×
![]()
As small-cap commercial real estate gets battered by the pandemic’s brutal toll on U.S. small businesses, the small-cap multifamily sector has handsomely outperformed.
We recently reported on small-cap CRE’s turbulent times underscored by an unprecedented Q3 collapse in leasing demand across office, industrial and retail sectors that dispatched most investors to the sidelines.
On the other hand, the small-cap multifamily market’s stability, rendered by persistent demand for affordable rentals paired with uncommonly tight supply, offers investors and small-balance lenders much opportunity, if not relief. We calculated a U.S. Q3 vacancy rate of 5.3% for small multifamily assets of 5-40 units across a national inventory of 3.2 million inventory units, up a notable 50 basis points (bps) since the March outbreak but, then again, barely 20 bps more than the long-term average. Additionally, the national occupancy rate of 94.7% has not budged much, off 50 bps from Q1 but still above its historical norm.
×
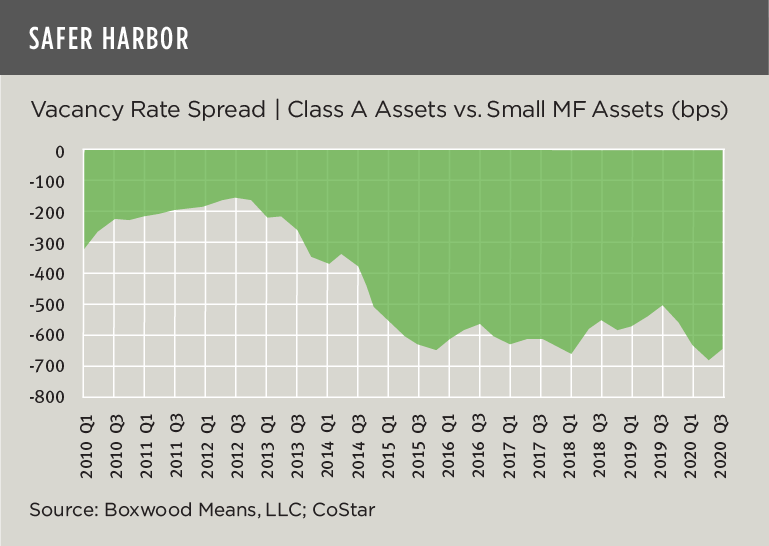
![]()
By contrast, the national vacancy rate for Class A multifamily properties clocked in at an average of 11.7%, up 60 bps since March and more than 200 bps above the long-term average. Furthermore, Class A occupancies, though relatively stable at 91.3% nationally, are far below rates for small-cap properties. As the nearby graph shows, the vacancy rate spread between Class A and small multifamily assets has widened by over 600 bps due to the double whammy of COVID-19 and robust construction of upscale or luxury apartment buildings.1
Similar outperformance in occupancy and rent trends among low-rise apartments versus high-rise buildings is borne out in a recent analysis by Realpage. Low-rise occupancy averaged 96.3% compared with 92.9% for high-rise inventory in September, while effective asking rents were still growing a bit for the former but declining substantially for the latter.
A slowdown in rent growth is not unexpected, even for small caps. After all, the economic effects of the pandemic have disproportionately hurt renters of affordable housing many of whom are inclined to hold down lower-paying and/or retail-oriented jobs. For example, more than half of renters (52%) earning $25,000 a year or less lost some amount of wages since March, and 20% of this same wage group reported being behind on rent according to the Census Bureau’s September Household Pulse Survey.
×
![]()
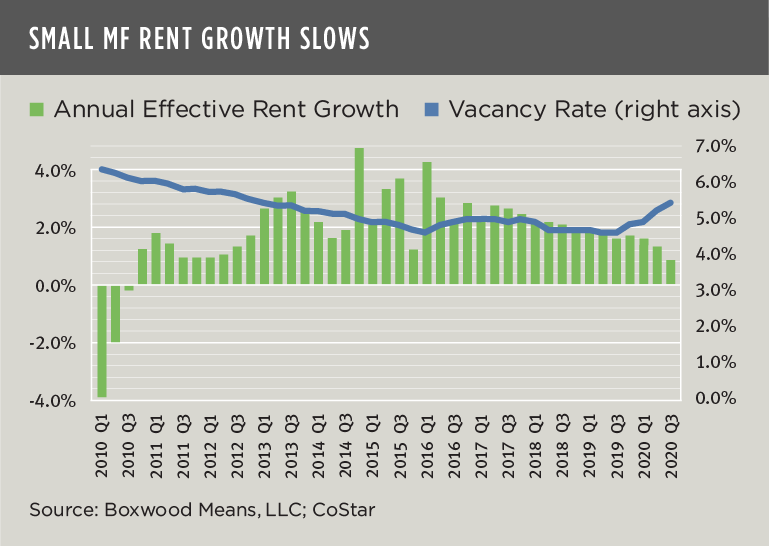
Against this backdrop, small-cap multifamily rent increases have receded to the lowest annual growth rate since 2010 (see the nearby graph). The Q3 annual effective rent growth of 0.8% represents an 80-bps decline since March and a sizable 130 bps reduction YOY.
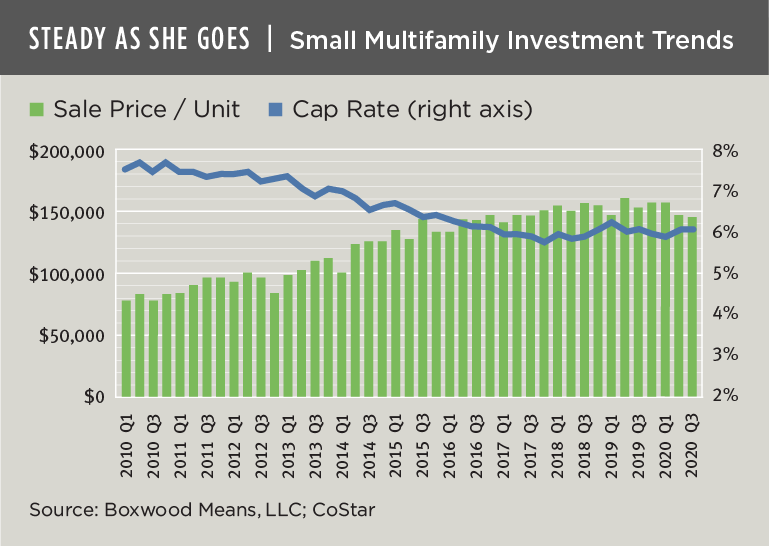
Nevertheless, small-cap multifamily investment trends have barely wavered (see the final graph). Sale prices, at an average of $145,600 per unit during Q3, have eased by only 1.8% since the beginning of the outbreak and 4.9% YOY. Cap rates averaged 6.07%, just 17 bps higher than March and 10 bps more than a year earlier.
Naturally, the sector’s performance going forward will be driven by numerous factors ranging from COVID’s containment, future availability of the vaccine, expanded federal financial support for vulnerable households and the speed of an economic and jobs recovery. Yet if this tumultuous year is any indication, small-cap multifamily assets will continue to be a welcoming port for small-balance lenders and investors amidst generalized market uncertainty.

 Randy Fuchs