×
![]()
With the small business economy on the mend, occupier trends in the small-cap CRE domain showed strong momentum during first quarter. However, office sector fundamentals continued to take a beating as the stickiness of remote work continued to impede a revival in leasing demand.
The Main Street economy is clearly looking up. Vaccinations are accelerating, federal support for small businesses and families was extended, more businesses have reopened, and small business job growth is improving. In fact, small business employment recorded the largest one-month percentage gain in almost eight years according to the March 2021 Paychex | HIS Markit Small Business Employment Index, with leisure and hospitality showing the most improvement. Furthermore, the March reading of the WSJ/Vistage Small Business CEO Confidence Index rose 19% YOY to its highest level in 2½ years as small business executives were particularly optimistic about the economy over the next 12 months.
Space Market Trends
Here are the key takeaways from our analysis of CoStar Q1 CRE data tracking U.S. inventory of for-lease buildings under 50,000 sq. ft.:
×
![]()
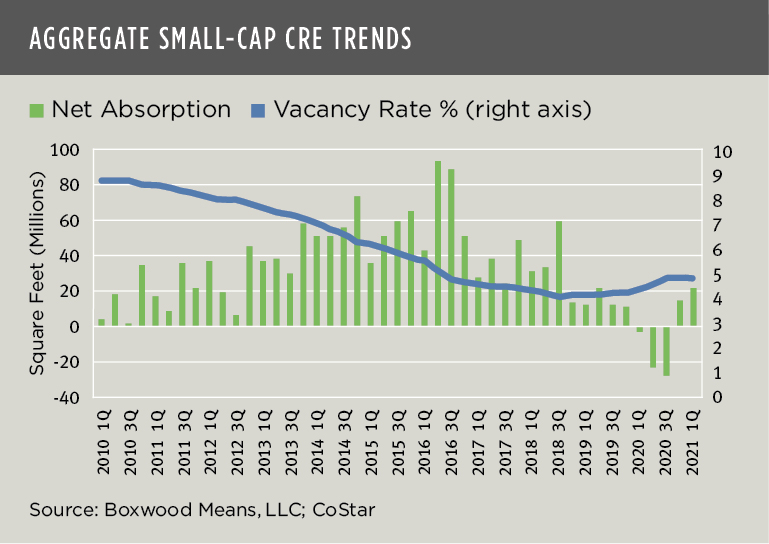
- Aggregate small-cap CRE leasing demand across industrial, retail and office sectors improved for a second consecutive quarter after three periods of negative net absorption. Net occupancies jumped 52% sequentially to a total of 21.3 million square feet – the highest volume in 10 quarters. (See the nearby graph.)
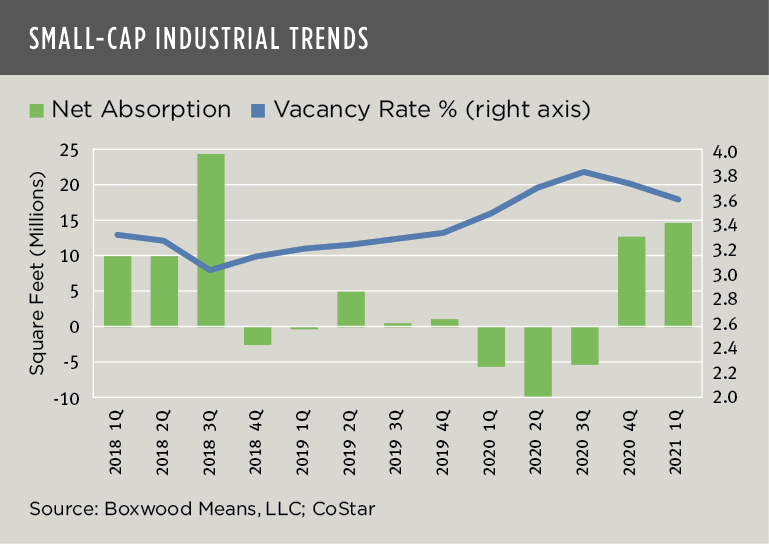
- With booming demand for small warehouse and manufacturing facilities, industrial net absorption soared to 14.4 million sq. ft., a sizable 22% above the long-term quarterly average. (See the nearby graph.) Retail occupancies increased as well as store openings accelerated, but the 9.9 million sq. ft. of net absorption gains was still 27% below historical norms.
- With recovering demand and little new supply, aggregate vacancies across the three sectors ticked down 10 basis points (bps) to 4.7%. The national industrial vacancy rate (3.6%) and retail rate (4.5%) remained substantially below historical averages.
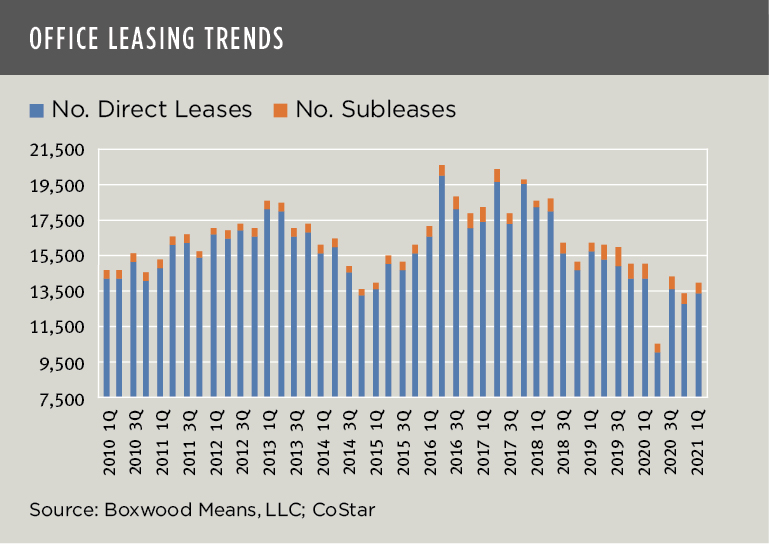
- Office vacancies tell a different story and possibly predict a new paradigm for this sector’s recovery and usage. The national vacancy rate edged up for the sixth consecutive quarter to 7.2% as net absorption remained negative for a fifth quarter in a row – the longest string since at least 2006. The toll has been sizable: Net occupancy losses during this time period totaled 34 million sq. ft. which expunged absorption gains over the preceding six quarters dating back to Q3 2018. As the nearby graph implies, remote work continued to stifle office demand with relatively subdued small-cap direct and sublease signings of late.
×
![]()
- Office sublease availabilities, at 19.8 million sq. ft., hit a new high and surpassed the previous record sum set at the end of the Great Recession. In certain markets, the sheer amount of indirect space will likely overhang the market and weaken the investment returns for small office buildings for a prolonged period into the future. Granted, conversations about the post-pandemic demise of office life are largely exaggerated, but a hybrid approach involving WFH for a couple of days per week is increasingly likely for untold sums of office workers, especially in larger cities with long commutes.
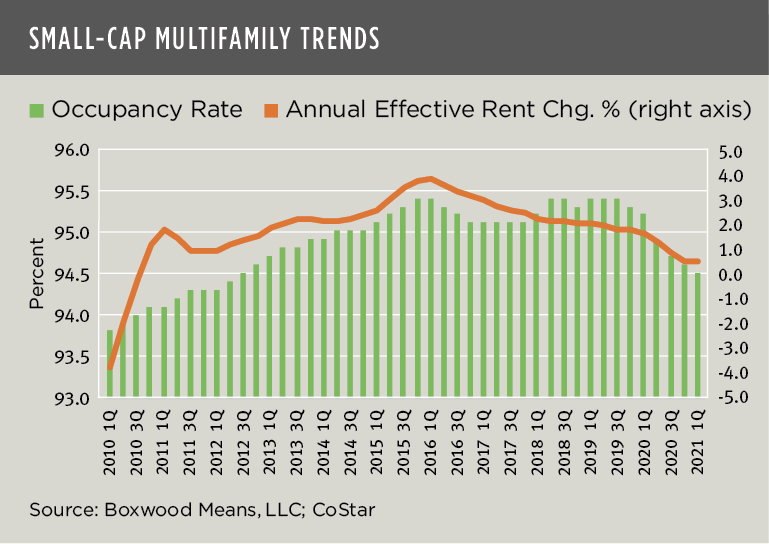
- Affordable rental housing fundamentals were soft as the pandemic, store closings, and lockdowns have disproportionately hurt low- and moderate-income families. Based on Boxwood’s analysis of Q1 CoStar data covering three million Class B/C units in rental buildings under 50 units, total occupancies, at 94.5%, improved 10 bps but remained at the lowest level in more than eight years. As a result, multifamily effective rent growth increased only 50 bps and at the lowest rate of increase in over 10 years. (See the nearby graph.) That said, we can anticipate that renewed federal housing and financial support, coupled with accelerating economic growth, will rapidly enhance multifamily operating fundamentals in the coming months.
Price Trends
×
![]()
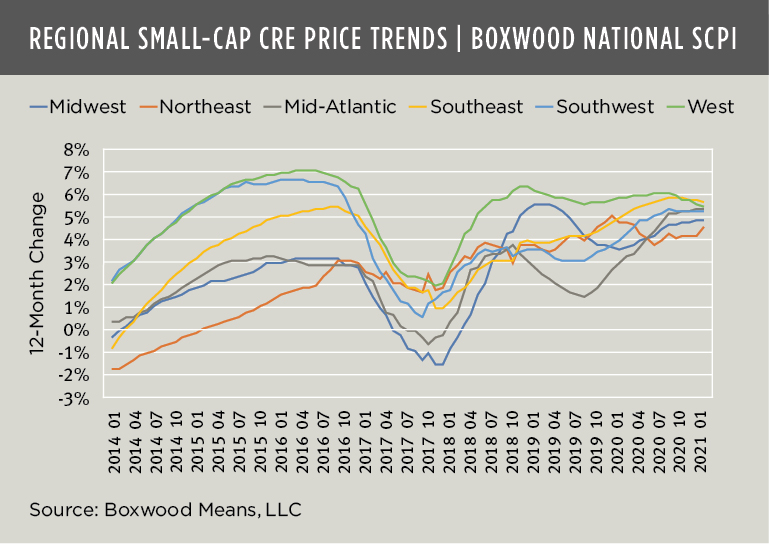
- Small-cap CRE prices have accelerated. Boxwood’s national Small Commercial Price Index (SCPI) covering 160 metro areas posted price gains for a fourth month in a row to an annualized rate of 4.9% in our latest reading as of January. This is the highest level in nine months and corresponds with increased investor confidence in the restoration of the Main Street economy.
- Prices moved higher in all U.S. regions led by the Southeast with an annual gain of 5.7% (where coronavirus-related lockdowns and social distancing restrictions were generally at a minimum) and followed by the West (5.5%), the Southwest and Mid-Atlantic (5.3%). Property values in the Midwest (4.8%) and Northeast (4.5%) rose at a slightly slower pace. (See the nearby graph.)
- Small-cap price gains were bolstered during the pandemic by sustained capital flows for asset acquisitions and loan refinancing. Otherwise, the sizable 19% drop in small-cap CRE sales transactions that Boxwood tracked during 2020 – to $206 billion from $255 billion in 2019 – may have exerted downward pressure on prices.
- Small multifamily prices continued to outperform. Boxwood’s Small Multifamily Price Index (SMPI) rose a hefty 7.4% during 2020 to the highest annual rate since the summer of 2018. While the 12-month gain slipped a bit to 7.3% during January, the overall strength of the national market is undeniable as 95 of the 101 markets posted annual increases (and led by 10% gains YOY in Charlotte, Lakeland-Winter Haven, and Columbus-OH).
×
![]()
Parts of the Main Street economy are presently humming (e.g., construction, manufacturing, transportation, professional services) while others have more catching up to do (e.g., restaurants, non-internet retail, other services). But signs of an economy poised for takeoff are everywhere: Startups are burgeoning; store openings are widespread; and job growth generally is booming. A small business resurgence seems awfully close at hand.

 Randy Fuchs