The pandemic was a hurricane of sudden, widespread chaos and devastation for small businesses and civic life. The toll from the emerging economic storm is still unpredictable. But the latest market data indicates that the current stability of small-cap commercial real estate leasing conditions may be at risk.
Here are the major takeaways from Boxwood’s analysis of a custom extract of Q3 CoStar leasing market data comprising office, industrial and retail properties under 50,000 sq. ft. and multifamily buildings between 5-40 units.
×
![]()
- Commercial vacancy rates hold the line. Across the three small-cap commercial sectors, the Q3 aggregate national vacancy rate hovered for another quarter at its record low of 4.0%, 40 basis points (bps) below the level of a year ago. This nadir underscores the strong tides of the small-cap CRE leasing market powered by the renaissance of small business growth following the GFC that then resumed after the Covid interregnum. If a recession unfolds next year causing massive layoffs and reductions in leasing demand, this low vacancy rate – a full 100 bps below the quarterly average over the past 10 years – will provide some ballast against a consequential reversal in the market’s present stability.
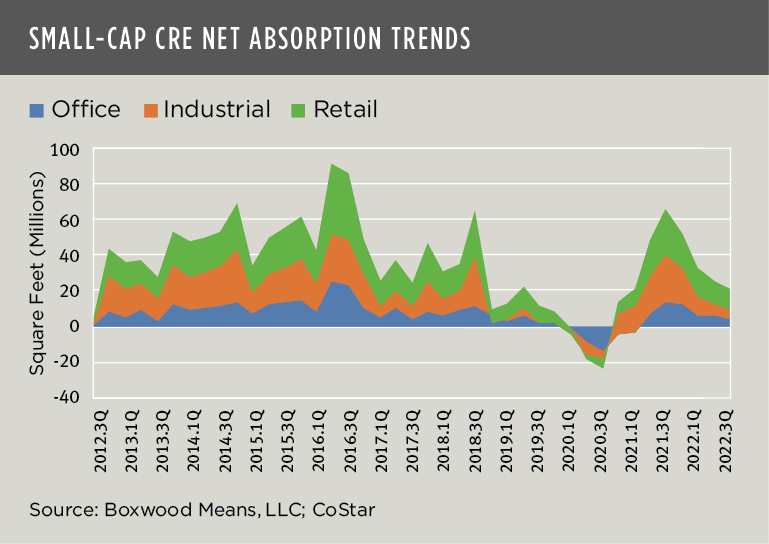
- Overall commercial tenant demand has narrowed. Aggregate net absorption of commercial space totaled 21.3 million sq. ft, down 17.3% sequentially and less than one-third of the 66.4 million in occupancy gains recorded during the same period last year. (Last year’s Q3 figure was a relatively unfair comparison period since it was the highest net absorption in over 25 quarters.) Clearly though, as a fourth consecutive quarterly decline in space demand signifies, leasing momentum has slowed as small business tenants increasingly lack confidence in the economy’s outlook. (See the nearby graph.) The Q3 Small Business Index from MetLife and the U.S. Chamber of Commerce bears this out; e.g., twice as many small business owners said the economy was in poor health versus good health, and nearly 90% are concerned that the economy is headed for a downturn in 2023.
- Multifamily demand slipped again. Net absorption of small-cap apartments fell for a second quarter in a row to roughly 1,800 units nationally, down from over 13,000 YOY and the lowest level since the onset of Covid. The small-cap occupancy rate held relatively steady at 96.1%. Here again, dwindling demand shows that confidence is lacking – this time among consumers. Net rental demand typically depends on new household formation, and these newbies have largely disappeared. According to RealPage’s Q3 research report, apartment demand has dried up across all building classes and price points as inflation and economic uncertainties preoccupy would-be renter households.
More specific leasing details on the small-cap office, industrial and retail sectors follow below.
Office – The national office vacancy rate ticked down 10 bps to 6.4%, within earshot of the record low of 6.1% and comfortably 120 bps below the 10-year average which may allay some fears that the sector was about to tank amid the self-sustaining WFH era. What is a bit surprising is the relative stability of small office building fundamentals, i.e., we hear a lot about how smaller office properties will suffer from tenant migrations to bigger, higher-amenity office locations. That has yet to show up in the national numbers. That said, office demand has weakened: Net positive absorption declined to only 3.9 million sq.ft., off 36.7% sequentially and a notable 71.9% YOY as the total number of newly signed leases (13,240) dropped to the lowest total in eight quarters.
Industrial – Vacancies for small industrial and flex buildings were unchanged at 2.9% for the third consecutive quarter, holding firm at its historically low point. Occupancy gains slowed to just 5.4 million sq. ft., down 12.1% from Q2 and a sizable 79.8% from 12 months earlier when nearly 27 million sq. ft. were absorbed. Importantly, the roughly 8,100 leases signed during Q3 were the lowest total in 15 years, reflecting in part the weaker demand for goods in the manufacturing sector and slowing business investment cited in the latest ISM Report.
Retail – The national retail vacancy rate for small retail and strip centers, and freestanding retail stores held steady at a record low of 3.6%. Demand remained in positive territory with 11.9 million sq. ft. of gains in net occupancy, but here, too, there was diminished tenant demand: Net absorption declined 10.7% sequentially and 53.4% YOY. Consumers boosted their spending in stores during August suggesting that some household resilience remains despite slowing wage growth, higher prices, and soaring interest rates.
The continuing slowdown in across-the-board leasing velocity reflects mounting concerns among small businesses that economic conditions will get worse before they get better. The Federal Reserve appears hellbent on taming the inflation tiger, and the current regime of interest rate hikes has taken the air out of the proverbial balloon, has raised market risks, and may level potentially punishing effects on all commercial real estate market participants.

 Randy Fuchs