Government reports indicate that the US economy is still advancing, but it seems like cold comfort for small businesses that increasingly face headwinds to sustained growth. It was only a matter of time before weaker conditions on Main Street would bleed through and impede small-cap CRE occupier fundamentals. And indeed, it has: small-cap commercial leasing activity retreated during the first quarter for the first time since the pandemic era.
With inflation and high interest rates permeating all corners of the economy, GDP growth increased at a decreasing 1.1 percent annual rate during Q1, or less than half the rate in the previous quarter. As a result, small businesses face rising challenges to profitability from higher input and financing costs, and lower sales. According to NFIB’s March report, optimism among small business owners was at the lowest level since at least 2018, and owners’ outlook for growth was downbeat because of their concerns over near-term economic conditions.
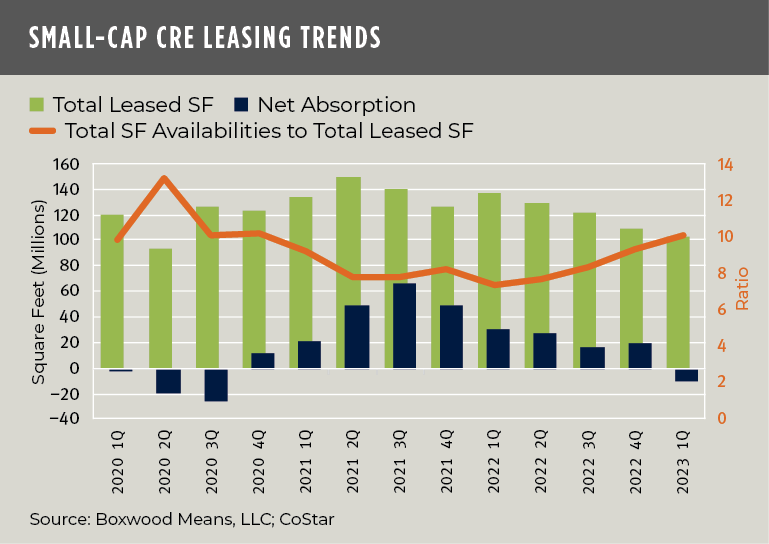
These economic uncertainties translated into a hefty pullback in office and industrial leasing activity. On the other hand, the retail sector produced a positive surprise. Highlights of Boxwood’s analysis of Q1 CoStar national data on small commercial properties under 50,000 sq. ft. include:
×
![]()
-
Overall Space Demand Faltered. With the slowdown in GDP and employment growth, the industrial and office sectors suffered occupancy losses totaling a combined 14 million sq. ft. This reversal occurred as the industrial sector lost one thousand manufacturing jobs during March, in stark contrast with a gain of over 60,000 a year earlier, while the increase of 10,000 jobs in the transportation and warehousing industries reflected a 60% YOY decline. A sizable drawdown in inventories also led to less demand for warehouse space. Meanwhile, the negative absorption attributed to the office sector reflects the fact that leasing of small office buildings is suffering from the same ill consequences of WFH with which institutional office properties are plagued. See the nearby graph showing leasing trends for all three sectors combined.1
-
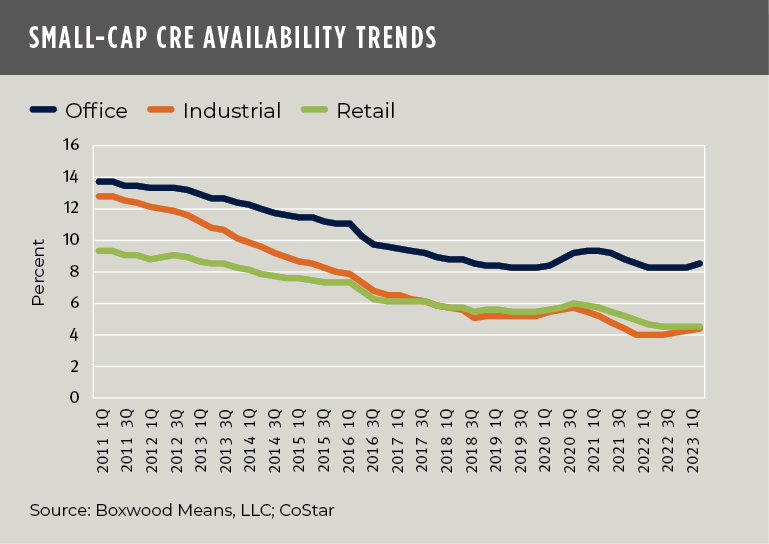
Rising Availabilities Were Contained. Across the three property types, total space availabilities rose 20 basis points both sequentially and YOY to 5.4%. Though a notable quarterly increase, the average availability rate since the GFC is substantially higher at 8.0%.2 That being said, an increase of three million sq. ft. of Q1 sublet space was a contributing factor to the higher level of overall availabilities and bears watching. In fact, at a surplus of 48 million sq. ft., open sublease space is 14% above the average over the past 12 years. See the nearby graph showing sector availability trends.
-
×
![]()
Retail Defied Expectations. The staying power of neighborhood retail and strip centers is continually underestimated. Predictably, in-person shopping has returned big time, and retail demand was also fired up by robust Q1 consumer spending and growth in disposable personal income. As a result, retail registered five million sq. ft. of occupancy gains that blunted the sector’s nominal uptick in sublet space while holding the total vacancy rate in check at a record-low 3.5%.
The incident of negative space absorption, coming after nine consecutive quarters of encouraging, positive demand since the tapering of the pandemic’s chaos, may not be a one-off, i.e., it may signal more fallout ahead for Main Street businesses and CRE. Note that an instance of two or more consecutive quarters of negative absorption have occurred twice over the past 15 years – both associated with economic recessions. However, while a macroeconomic slowdown is clearly afoot, the recession that many observers expected in Q1 failed to transpire and may not arise in Q2 either if the nation’s economic and employment conditions remain resilient.

 Randy Fuchs