×
![]()
The Sirens were simultaneously beautiful and treacherous creatures of Greek mythology whose enchanting voices and music tempted mariners to draw near, only to shipwreck on the rocky shores of their island. Though their fate is far less cataclysmic, several de novo lenders - some with bucket loads of venture capital for online marketplaces - were beckoned by the siren call of the small balance lending (SBL) market and now face a stark reality: the ostensibly highly-fragmented and boundless opportunities of the space aren't exactly what they were cracked up to be.
Clearly, the overall size of the SBL market is inviting. Total origination volume during 2015 reached a new peak of $181.3 billion, the highest total since at least 2006 and encompassing over 200,000 individual purchase and refinance transactions according to Boxwood's research. Perhaps even more seductive is the fragmentation of the SBL market at the national level. For example, our research indicates that last year the top 15 lenders accounted for only 23.4% of the total market for SBL loans under $5 million, up 1.3% from 2014 but oscillating within a narrow range for years. Moreover, the next 50 top-ranking producers commanded only 12.9% of the market, underscoring the sizable fragmentation for the remaining 60% of the origination market at the national level.
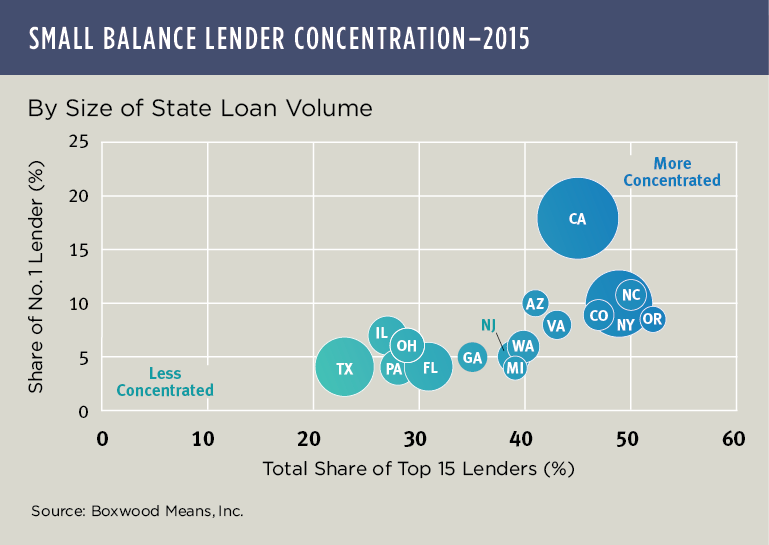
But this welcoming aerial picture can often distort what may be a more hazardous, ground-level reality. Accordingly, if we sharpen our vision from the national to state level, the degree of market fragmentation changes dramatically. In other words, the level of competition for loans grows more intense. The nearby bubble graph shows the market size and level of lender concentration for a variety of states using last year's data. The bigger the bubble, the greater the loan volume, with states to the upper right with higher degrees of lender concentration, and states in the lower quadrant showing less concentration. California and New York pop out as the biggest markets with annual loan volume of $32.7 billion and $21.7 billion, respectively, but also stiff competition that pose some barriers to successful entry: e.g., California's No. 1 lender seized a sizable 18% market share and the top 15 accounted for an imposing 45% of total state volume; similarly, New York's No. 1 lender commanded 10% of the market and the leading 15 firms a collective 49% share.
Other states offer relatively better opportunity. Take Texas for example: third greatest annual loan volume at $17.5 billion with the leading 15 lenders grabbing only 23% of the total market; or Florida with $10.7 billion and a slightly higher capture rate of 31% for the top 15. Obviously, some of the states represented by smaller bubbles mid-graph suggest a less attractive risk-return profile.
Of course, this competitive landscape can be reshaped or disrupted over time as borrowers seek better financing solutions to meet their needs. Then again, the state lender concentration figures above have proven to move, albeit slowly, towards greater concentration over time, not less.
We can already see the impact of this intense competition on naive lending strategies by mid-course changes in direction by a couple of national SBL platforms, e.g., to different types of borrowers as well as towards other asset classes.
The SBL market is indeed enormous and promises bountiful opportunities. However, as Boxwood's research shows de novo national lenders in particular need to be mindful of the perilous Sirens lurking in the space.
