×
![]()
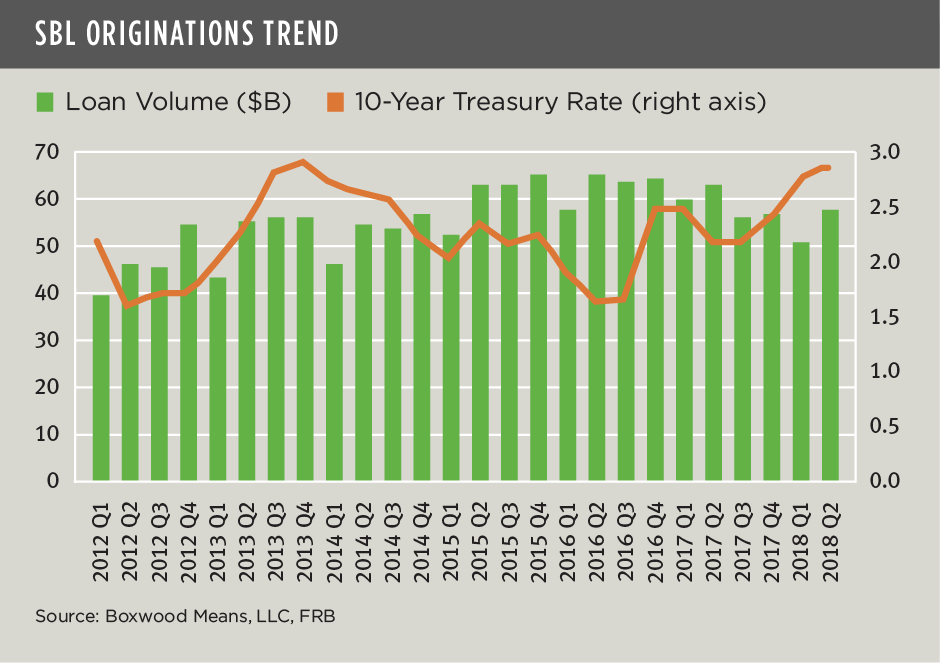
Small-balance commercial loan originations rose by 12.6% during Q2 to $57.0 billion as small-cap CRE investors and operators continued to take advantage of a favorable lending climate resulting from a surplus of debt capital coupled with strong operating and investment fundamentals.
Though Q2's total was the largest in four quarters, the cumulative mid-year total of $107.6 billion trailed last year's record production pace by 11.3%. Even so, this massive lending space for loans under $5 million is shaping up to exceed $200 billion for the sixth year in a row despite the Fed’s introduction of two, 25-basis point hikes in short-term lending rates through June. (See the nearby graph.) Meanwhile, the benchmark 10-year Treasury rate of 2.85% at mid-year increased by just 45 basis points since the beginning of the year and has yet to deter prospective borrowers. After all, by comparison the average 10-year Treasury during the previous market peak was well above 4%. So with cap rates for smaller CRE assets averaging roughly between 6-8% or more depending on property type and region, there’s still plenty of yield cushion or risk premium for investors.
Meanwhile, we can also report that the top commercial banks have recently upped their game in the SBL space by commanding 18.7% market share during Q2, up 6.8% sequentially and 3.9% YoY, and led by perennial front-runners JP Morgan Chase (5.3%) and Wells Fargo (2.6%). CBRE Capital Markets (1.9%), ranked #3, was the only non-bank among the top 15 lenders, as the firm posted the largest increase in market share percentage from 12 months earlier. While other non-banks and debt funds have not yet registered on the leader board, their aggressive lending has continued to erode the aggregate percentage share of the top banks that hovered in the low 20's range as little as five years ago.
For additional statistics and trends for this period, download Boxwood's complimentary SBL National Report here. See this page for information on our SBL reports with loan activity at the state level available via paid subscription.
