The geographic focus of commercial real estate value creation is shifting. While investors have traditionally favored large commercial and multifamily assets in major metro areas, smaller CRE properties in secondary and tertiary markets have increasingly outperformed, delivering stronger market returns and higher price premiums—especially since the pandemic.
Boxwood’s Small Commercial Price Index (SCPI) and Small Multifamily Price Index (SMPI) have closely tracked this notable change in price momentum, focusing on U.S. CRE property sales under $5 million. Below, we highlight key short- and longer-term trends and insights from Q1 data.
×
![]()
Sluggish Growth in the Largest Metros
-
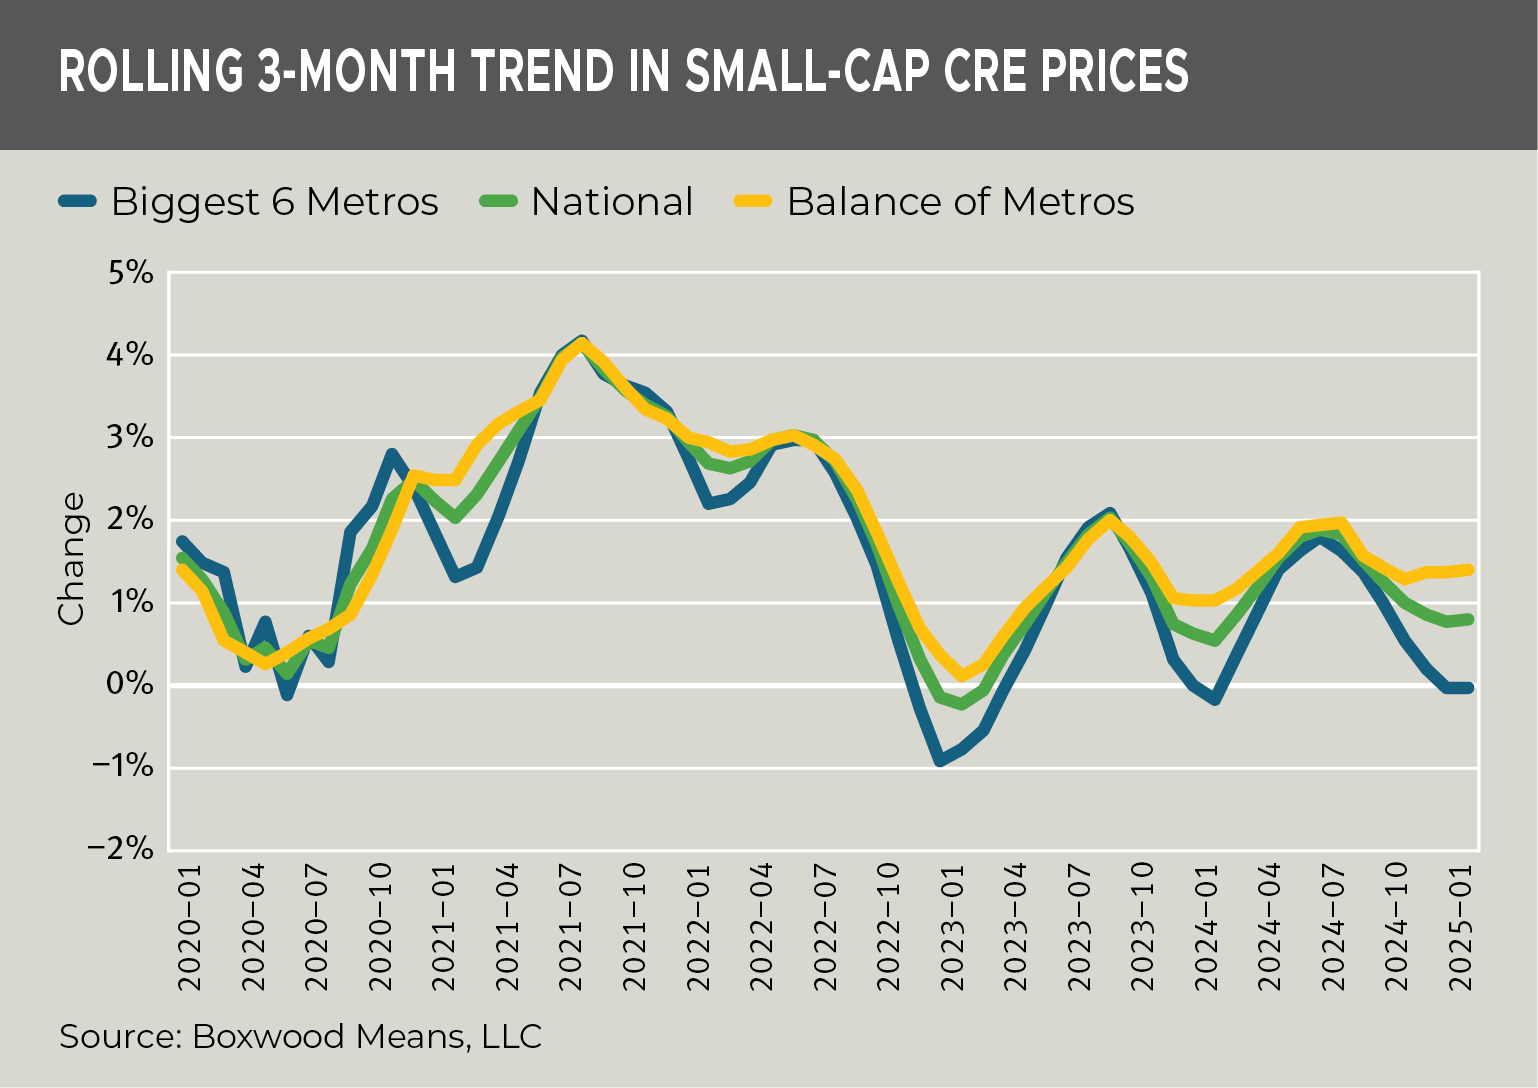
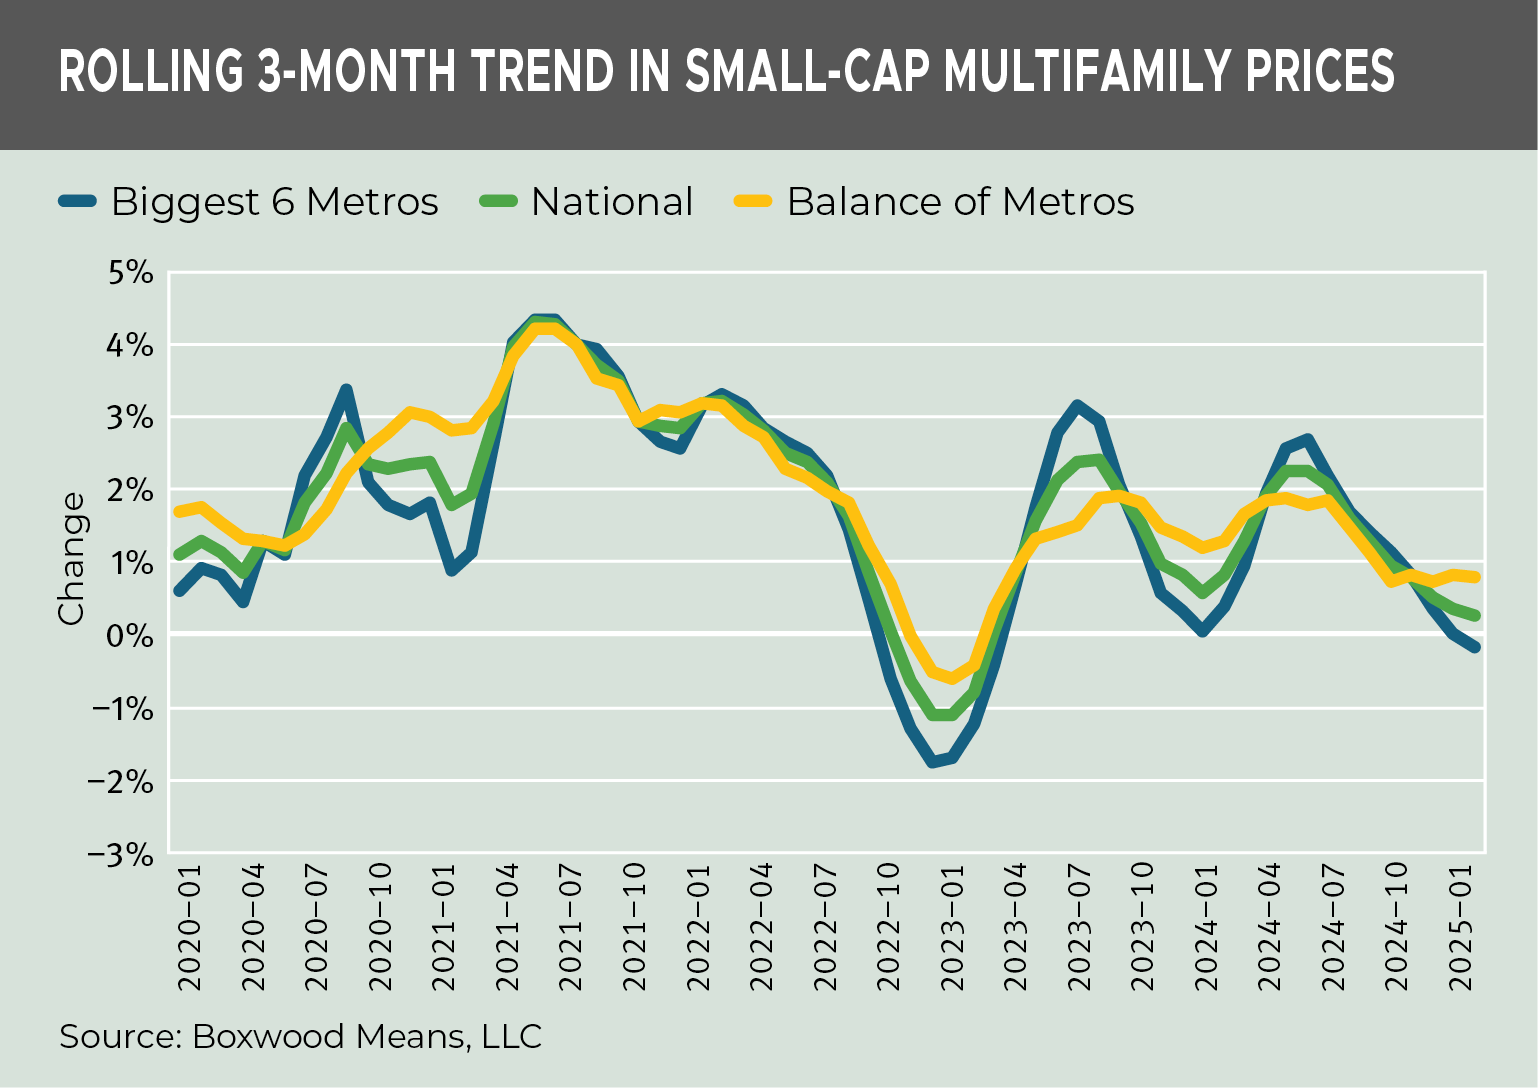
The top six population centers have lost their shine. CRE prices in the largest six metros were flat in Q1, with 0.0% growth—marking the third consecutive rolling three-month period of stagnation. The multifamily sector followed a similar pattern, turning slightly negative in Q1 with a -0.2% dip after weak growth in the previous two periods.
-
Smaller markets continue to outperform. In contrast, secondary and tertiary CRE markets posted a 1.5% gain in Q1, continuing a streak of solid growth across recent rolling three-month periods. See the first graph showing the sharp divergence in price trends between the balance of metros—gold line representing 160 metros—and the Top 6 metros—blue line.
Multifamily price trends mirrored this variance: prices in the smaller metros rose 0.8% in Q1, reinforcing the growing performance gap between market tiers. See the second graph illustrating the reversal in multifamily price direction.
×
![]()
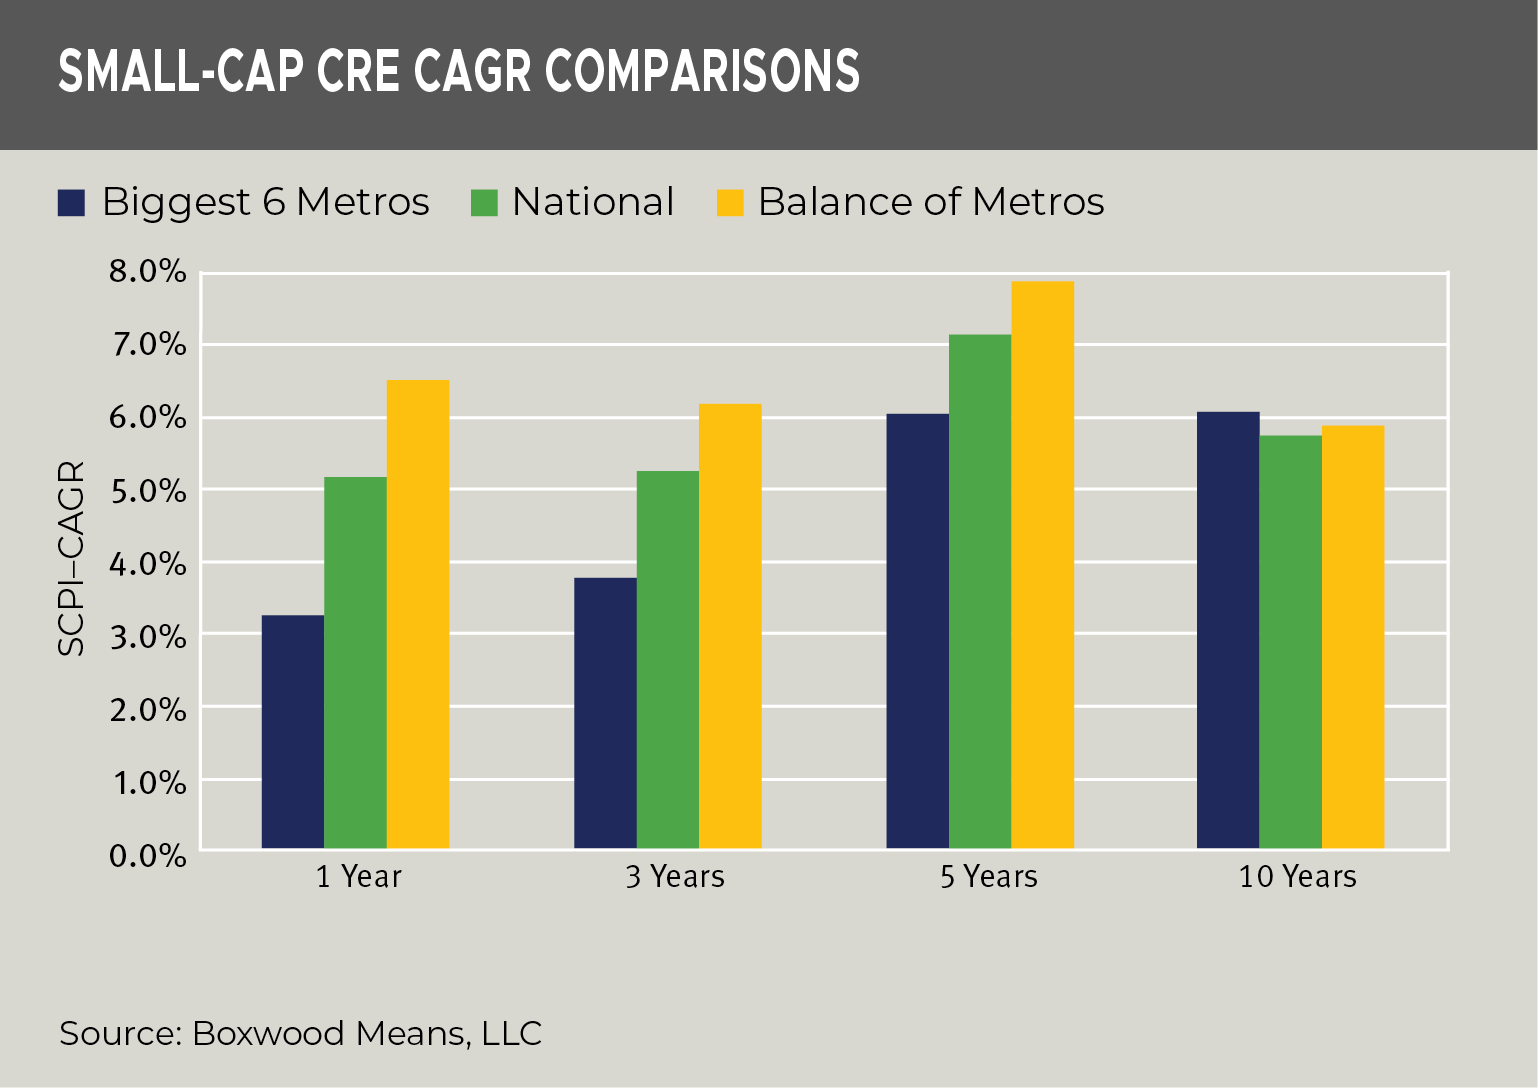
Sustained Outperformance by Non-Major Markets
×
![]()
See the third graph for this long-run performance comparison.
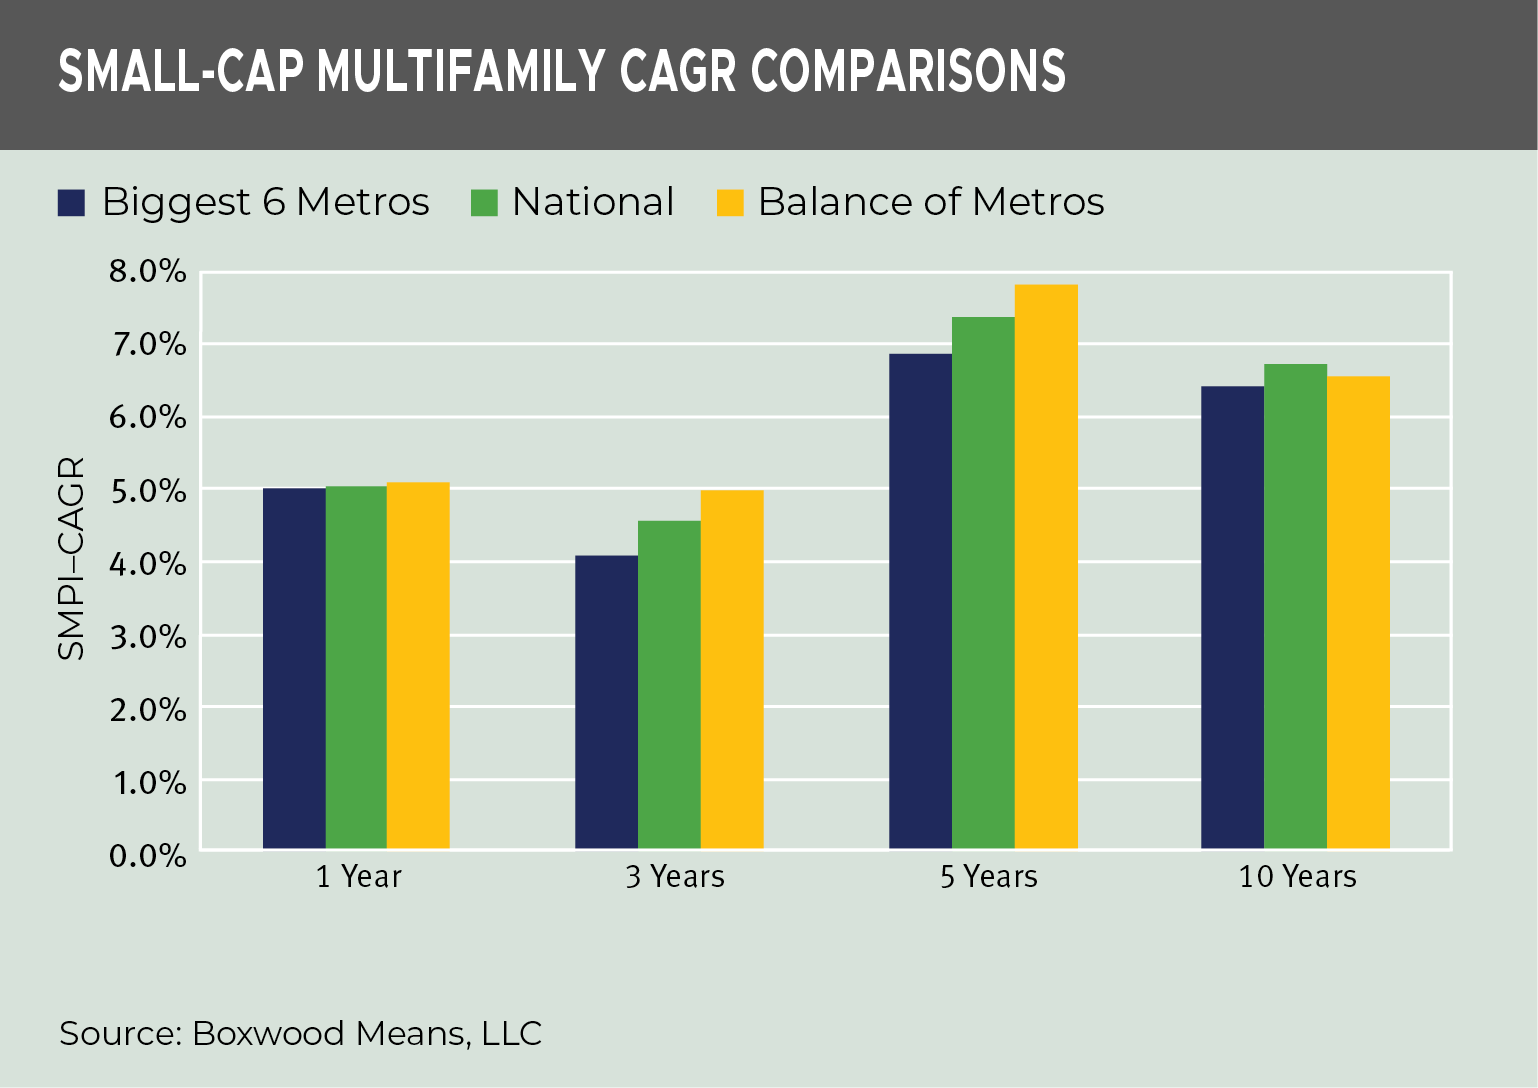
See the final graph for the smoother but consistent upward trend in non-major multifamily markets.
×
![]()
Key Takeaways and Talking Points
-
Major metros no longer command a performance premium, due to pandemic-driven, population out-migration and remote work, higher costs of doing business, tighter regulations, and new building supply constraints among other factors.
-
Smaller markets are more affordable, given higher concentrations of small apartment and commercial buildings with stronger occupier fundamentals—such as lower vacancies and more stable demand—resulting in faster NOI and price growth compared to overbuilt, big urban cores.
-
Private investors and owner-occupants dominate in smaller metros. These local buyers are typically long-term holders, contributing to tighter inventory and sustained pricing support.
-
The balance of metros has materially outperformed the Top 6 across multiple recent timeframes. While annual differences in CAGR may appear modest, compounding creates a significant cumulative impact—often amounting to substantial added dollar value over time.
-
If this trend holds, it could signal a longer-term strategic reallocation of capital toward, and investor focus on smaller assets in secondary and tertiary markets.

 Randy Fuchs