×
![]()
The massive losses of Main Street jobs and commerce since late March sent a shock wave through the small-cap CRE market with devastating Q2 results that underscore the unique vulnerabilities of small businesses to Covid-19 and related shutdown orders.
We are experiencing the worst recession in history, and small businesses that typically own or occupy small warehouse and light industrial facilities, modest office buildings and various retail locations among other uses, are shouldering the full weight of the economic catastrophe.
The Q2 small-cap CRE market statistics bear witness to the fallout:
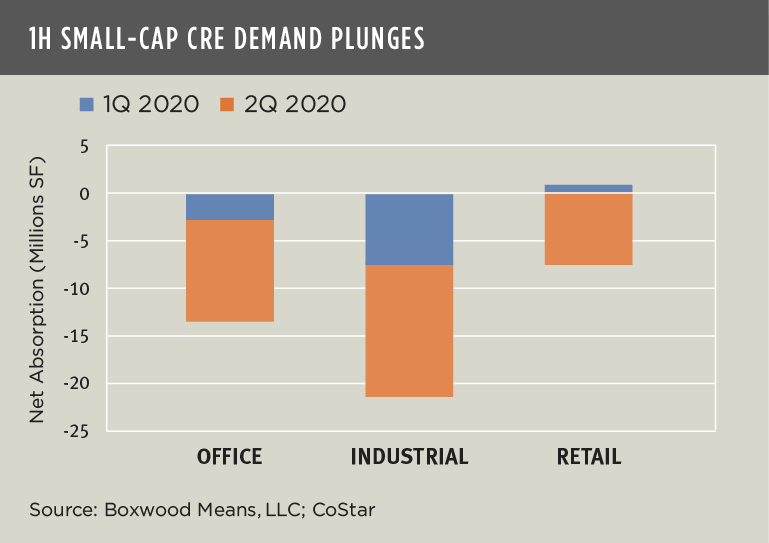
- Occupancies Sunk to Some Historic Lows. Space absorption was a net negative 31.3 million sq. ft. across office, industrial and retail sectors. (See the nearby graph.) It was the worst quarterly performance since Q3 2009 during the financial crisis and the second largest occupancy loss since at least 2006. Office demand fell into negative territory for the second quarter in a row with a loss of 10.5 million sq. ft., the highest recorded loss in at least 19 years. The industrial sector fared even worse, with Q2 occupancy losses of 13.5 million sq. ft. and totaling net negative absorption of 21.3 million over the first half of the year. At a negative 7.3 million sq. ft., the retail sector suffered its first occupancy losses since Q2 2012.
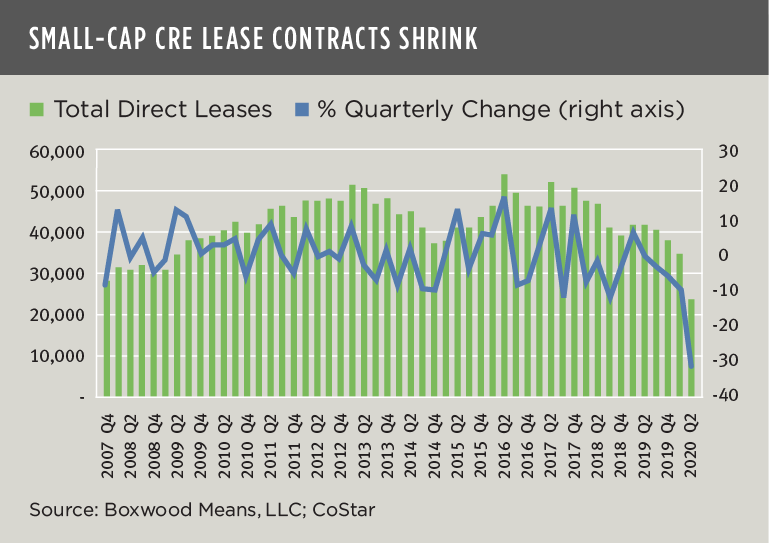
- Lease Signings Evaporated. The aggregate number of direct lease contracts across the three property types plunged 31.5% sequentially and 43.7% YoY. The 23,242 total contracts were the lowest since the run-up to the Great Recession in late 2007. (See the nearby graph.)
- Vacancy Rates Increased. Considering the drag on leasing, vacancies rose from historic lows. Q2 aggregate vacancies rose 20 basis points and 40 bps YoY to 4.6% -- the highest rate since Q4 2016. The national office vacancy rose a bit higher relative to the other sectors (30 bps) as total sublet availabilities increased above 16 million sq. ft. to the highest level since the financial crisis in 2010.
×
![]()
The colossal impact of the pandemic on small business real estate reflects its greater risks attendant to short term leases, small tenants with potential cash flow problems, and the (lower) quality or competitiveness of these assets among other considerations. By contrast, the higher proportion of institutional quality and/or national tenants that tend to occupy superior buildings has resulted in relatively more stable space market fundamentals in the general CRE market. For example, while leasing demand plummeted YoY across the board for general retail (-94.8%), office (-75.4%) and industrial (-26.9%), net absorption nevertheless remained positive for all three sectors, led by gains of nearly 150 million sq. ft. of industrial space according to CoStar data. Also, and not surprisingly given Covid-19’s disproportionate impact on consumers’ changing buying behavior, retail’s Q2 positive net absorption amounted to a nominal 2.5 million sq. ft.
As these latest market trends bear out, the substantial bifurcation in the well-being of small- and large-cap CRE markets is discernable and growing. Recent outbreaks of infection in different parts of the country tragically loom as a major threat to the nation’s economic recovery generally and, more specifically, to the long-term health of small-cap CRE and its property owners, investors and tenants across a broad spectrum of occupant uses. It seems increasingly vital for Congress to come together and pass additional relief measures very soon or else likely witness further distress for legions of small businesses and unemployed workers.

 Randy Fuchs