×
![]()
In the annals of CRE asset prices, the spotlight has typically illuminated the performance of the largest markets at the expense of the smaller ones. However, as the national economy rebounded last year the lesser markets flipped the script and outshone the more visible metropolises amidst unprecedented, super-charged, and widespread property sales and price growth. With general expectations that neither inflation nor the pandemic will create much drag on economic growth in 2022, this shifting balance in market power appears to have legs.
It’s well known that exceptional price growth has permeated all corners of the real estate world. For example, the S&P/Case-Shiller U.S. National Home Price Index – which has averaged an annual increase of 4.2% since 1987 – summited at a record 20.0% gain this past August and still hovered nearby at 19.1% during October. Also, as of September RCA reported that its CPPI National All-Property Index for principal asset sales above $2.5 million rose 16.1% over 12 months.
Similarly, Boxwood’s National Small Commercial Price Index (SCPI) that tracks sales under $5 million across 160 metro areas accelerated through much of 2021. SCPI compiled double-digit growth over four consecutive months culminating with a record 13.2% average annual growth rate during our latest reading in October – the highest 12-month return in at least 15 years. With record property sales of $243 billion over 10 months – 43% above the 2020 pace – it’s no wonder that prices have skyrocketed.
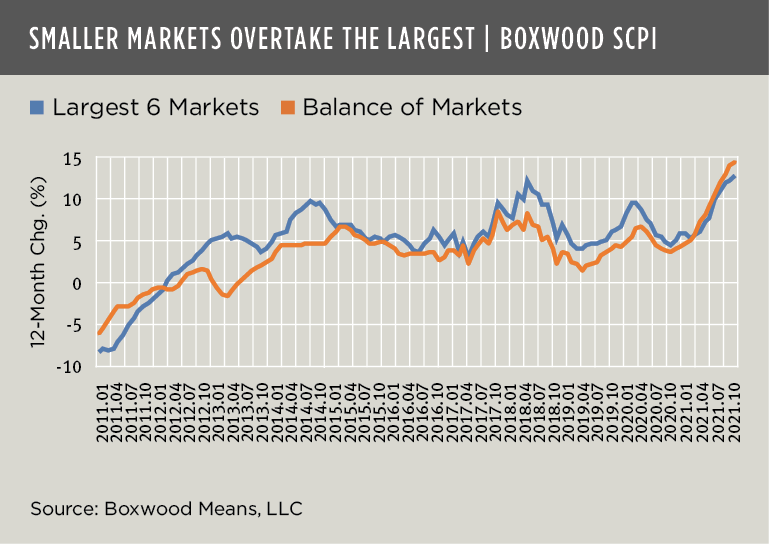
Yet along with these high-altitude prices is a noteworthy CRE market reversal. After trailing for years, small-cap prices in secondary and tertiary markets have outstripped the rate of growth by the six biggest metro areas for virtually all of 2021 (see the nearby graph). These Balance of Markets recorded a 12-month return of 13.8% in the latest available period while the six largest population centers produced a 12.3% gain. With a concentration in the Northeast, the top secondary/tertiary market performers YOY included Boston, Wilmington, Hartford, Springfield, and New Haven.
We observed a similar but even wider spread among these market categories in the large-cap CRE market. According to RCA, property prices in their six major metro areas rose 13.2% through Q3 of 2021 while jumping 16.2% in non-major markets.
Clearly, as the economy and CRE space markets roared back this past year, both big- and small-time investors leaned heavily into the smaller metro areas where the risk-reward profile for assets had markedly improved.
Small-balance commercial lenders will do well to take heed of this change in market leadership.

 Randy Fuchs