Overview
Transaction volume, pricing, and cap rate data from 2018–2025 show that the small-cap CRE market experienced a pronounced boom in 2021 followed by a multi-year reset driven by higher interest rates and tighter credit. Sales volume corrected first and most sharply, bottoming in 2023 before partially recovering in 2024–2025. Cap rates followed, expanding across all property types as return expectations normalized. Prices per square foot proved to be the stickiest variable, adjusting unevenly and with meaningful variation by sector. By 2025, multifamily and retail show the clearest evidence of market clearing, with cap rates, prices, and volume moving back into closer alignment. Industrial remains only partially repriced, while office continues to struggle with low liquidity and uncertain price discovery.
Introduction
After three years of disrupted pricing signals, small-cap CRE is beginning to sort itself out. The past two years, in particular, marked a transition from frigid markets and aspirational pricing toward more selective – but functional – market clearing. This adjustment has not occurred uniformly across property types. Some sectors have realigned transaction volume, pricing, and cap rates in a way that supports sustainable liquidity, while others remain caught between legacy pricing expectations and today’s capital realities.
Using three fundamental indicators – transaction volume, price per square foot, and cap rates – we can distinguish between sectors that have largely found clearing prices and those still undergoing adjustment. While macroeconomic uncertainty may yet influence outcomes, current data provide meaningful insight into how different property types are navigating the reset.
We first present a snapshot of these three metrics through 2025. We then offer an integrated view of them to assess how market conditions diverge across the four principal property types.
A Data-Grounded View of Small-Cap CRE (2018-2025)
Transaction volume, pricing, and cap rate data from 2018–2025 indicate that the small-cap CRE market has moved through a full boom–reset cycle and is now entering a more selective recovery phase. Activity peaked in 2021 amid historically low interest rates and abundant liquidity, then declined sharply as financing costs rose and underwriting tightened. Transaction volume adjusted first, followed by cap rate expansion, while prices per square foot adjusted last and unevenly.
Below is a summary of recent trends across the four property types on a standalone basis employing CoStar data for properties trading below $5 million in value.
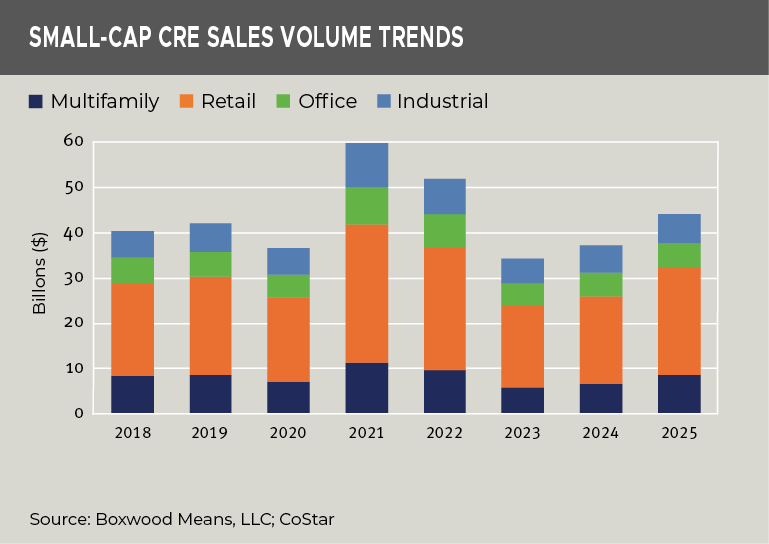
Transaction Volume
×
![]()
-
Retail: Largest share of total volume throughout the period; strong recovery in 2025 (+22.3% YOY)
-
Multifamily: Most volatile cycle; steep post-2021 decline followed by a solid rebound (+28.0% YOY)
-
Industrial: Volume contracted materially after 2022 and has only partially recovered (+9.1% YOY)
-
Office: Sustained weakness since 2022 (+4.6% YOY), signaling persistent liquidity issues
Key takeaway: Aggregate sales volume rose 18.7% YOY, reaching its highest level since 2022—an early signal of improving market conditions.
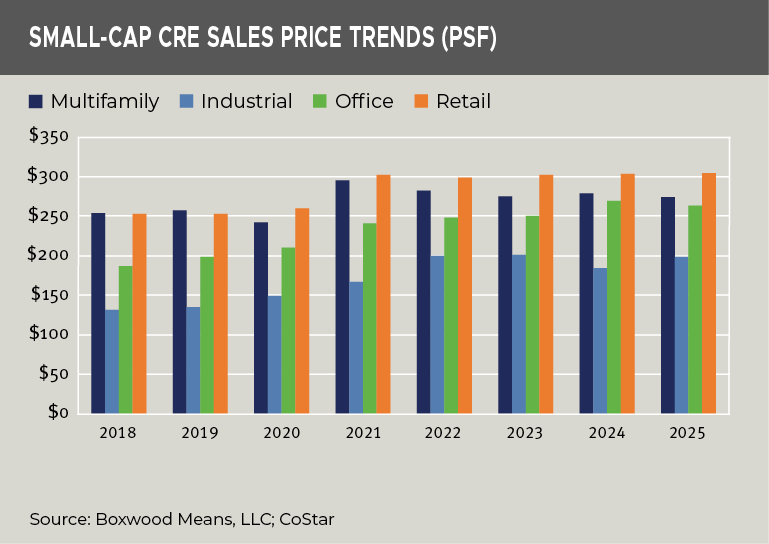
Price per Square Foot
×
![]()
-
Retail: Prices remained resilient, largely plateauing after 2021 at $305 PSF
-
Multifamily: Prices peaked in 2021, corrected in 2023, and stabilized through 2024–2025 at $274 PSF
-
Industrial: Strong long-term appreciation; prices rose 7.3% YOY to $199 PSF
-
Office: Gradual increases over the cycle, though down 2.2% YOY to $264 PSF
Key takeaway: Prices have remained sticky, lagging both the decline in volume and the expansion in cap rates.
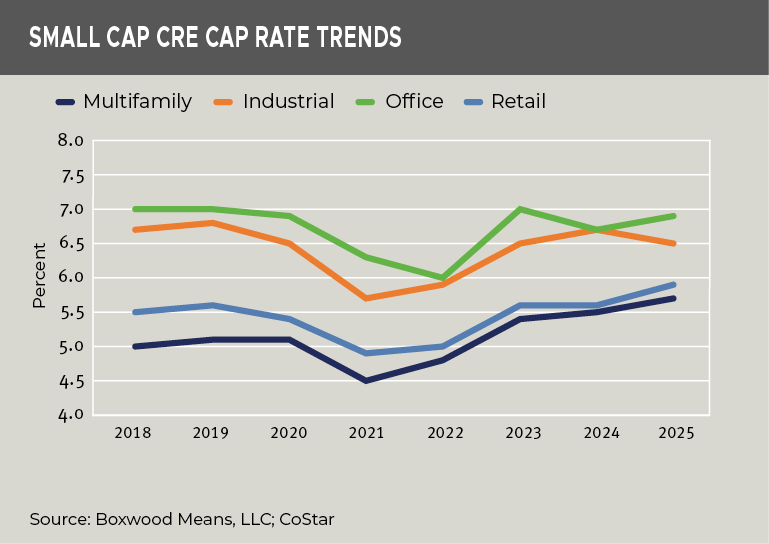
Cap Rates
×
![]()
-
Retail: Cap rates firmly rose to 5.9% (+30 bps YOY), improving yields while prices held firm
-
Multifamily: Continued expansion to 5.7% (+20 bps YOY), consistent with repriced values and recovering volume
-
Industrial: Cap rates remain elevated at 6.5% (−20 bps YOY), though not enough to offset prior price gains
-
Office: Expanded to 6.9% (+20 bps YOY), reflecting heightened uncertainty and asset-specific risk
Key takeaway: Cap rate expansion provided the clearest signal of changing risk perceptions, particularly after 2022.
An Integrated View
Taken together, these metrics help explain why opportunity differs meaningfully by sector. Where volume adjusted first, cap rates followed, and prices ultimately responded, markets appear to have cleared. Where these variables remain misaligned, uncertainty around pricing and liquidity persists, suggesting challenges that may be structural rather than purely cyclical.
To illustrate this dynamic, the integrated view below normalizes all three variables (indexed to 100 in 2018), allowing for direct comparison across property types as they navigated the reset.
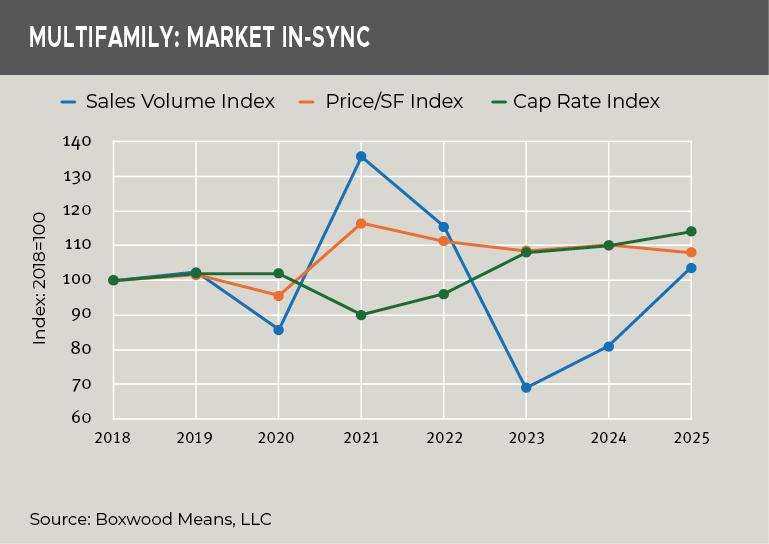
Multifamily: Broad Repricing, Real Liquidity
×
![]()
Multifamily entered the post-COVID period as the most actively traded and aggressively priced small-cap asset class. Volume surged in 2021 amid low interest rates and strong demand and rent growth expectations, followed by peak pricing and compressed cap rates.
The subsequent correction was pronounced. Transaction volume fell sharply in 2023, but unlike other sectors, multifamily prices adjusted meaningfully downward and cap rates expanded in tandem. By 2024–2025, volume recovered, cap rates continued to normalize, and prices stabilized at levels consistent with higher financing costs. See the nearby graph.
The key signal is synchronization. Volume, pricing, and cap rates are now moving in a coherent and economically rational manner, indicating that the multifamily market has largely cleared and liquidity has returned.
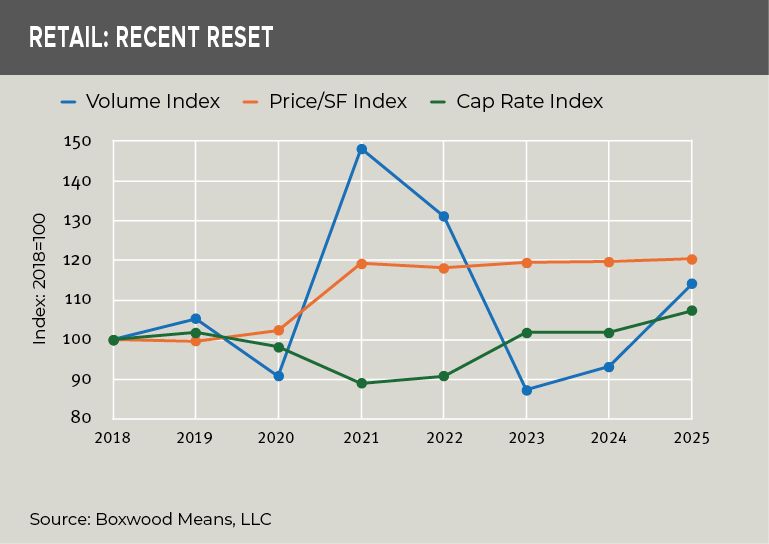
Retail: Yield-Driven Repricing and Stabilization
×
![]()
Retail's adjustment has been less volatile but increasingly durable. After years of structural pessimism tied to e-commerce, small-format and local service-oriented retail proved more resilient than expected. While volume declined in 2023, prices per square foot experienced little retrenchment. See the nearby graph.
Instead, the primary adjustment occurred through cap rates, which expanded materially between 2023 and 2025. This allowed prices to remain relatively stable while returns recalibrated upward. Transaction volume rebounded over the past two years as buyers grew comfortable underwriting retail cash flows at higher yields.
Retail now exhibits one of the clearest post-reset profiles: stable pricing, normalized cap rates, and recovering liquidity – evidence of a market that has re-established equilibrium without significant dislocation.
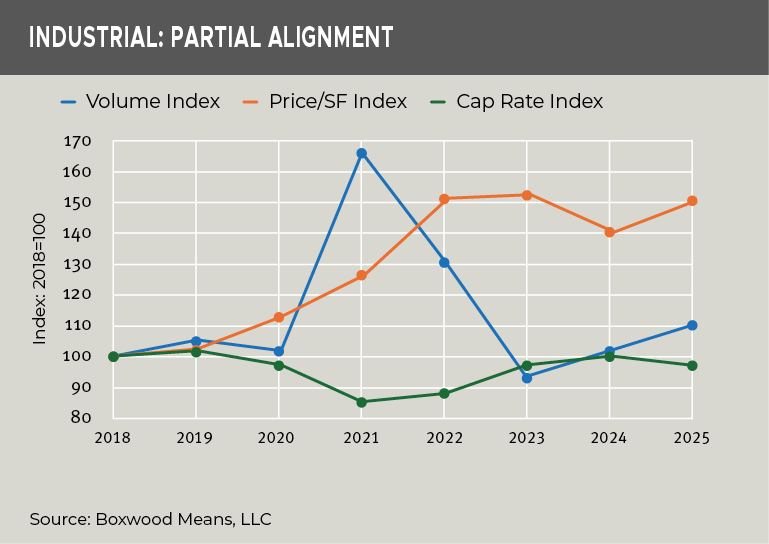
Industrial: Price Strength Without Full Liquidity
×
![]()
Industrial remains the most bifurcated sector in the small-cap CRE domain. Prices rose sharply between 2018 and 2022, supported by logistics and urban in-fill demand, supply constraints, and institutional capital flowing downstream. Even as interest rates increased, pricing remained elevated relative to historical norms.
Cap rates moved higher after 2022, but not enough to fully offset prior appreciation. Transaction volume declined sharply and has only partially recovered, suggesting thinner liquidity than pricing alone would imply. See the nearby graph.
Industrial therefore appears to be operating in a holding pattern - supported by fundamentals but constrained by return expectations. Full price discovery may require either further cap rate expansion or more motivated selling.
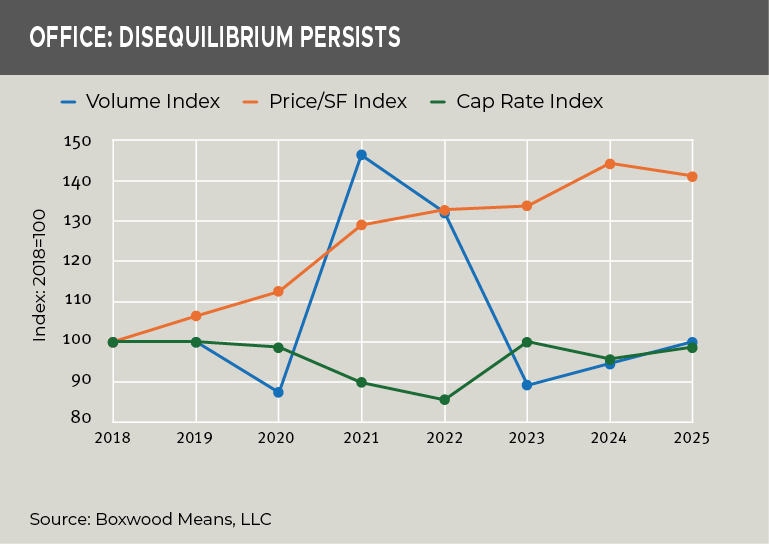
Office: Fragile Price Signals
×
![]()
Office stands apart in both structure and trajectory. Transaction volume has fallen sharply from 2021 levels and remains subdued. Although cap rates expanded materially, pricing has adjusted only incrementally, leaving bid–ask spreads wide. See the nearby graph.
As a result, price benchmarks appear superficially stable but structurally fragile. Limited transactions tend to be highly asset-specific, complicating underwriting and increasing valuation uncertainty. Unsurprisingly, the office market has yet to demonstrate clear evidence of market clearing.
Implications Going Forward
Alignment across volume, pricing, and cap rates remains the most important signal of market well-being. Where these variables move together, liquidity improves and risk becomes more measurable. Where they diverge, uncertainty persists.
For small-time investors, opportunity increasingly lies in sectors that have already undergone a valuation reset. Multifamily and retail offer clearer pricing signals and better exit visibility. Industrial opportunities are more situational, while office remains speculative and highly selective.
For lenders, this distinction is equally critical. Credit risk in 2026 is becoming more structural than cyclical. Markets that have cleared can be underwritten with greater confidence in exit values, while those that have not require more conservative leverage and return assumptions.
The past two years marked a transition from stalled price discovery toward selective market clearing in small-cap CRE. The next phase will favor participants who recognize where these key drivers align – and where they do not.

 Randy Fuchs