×
![]()
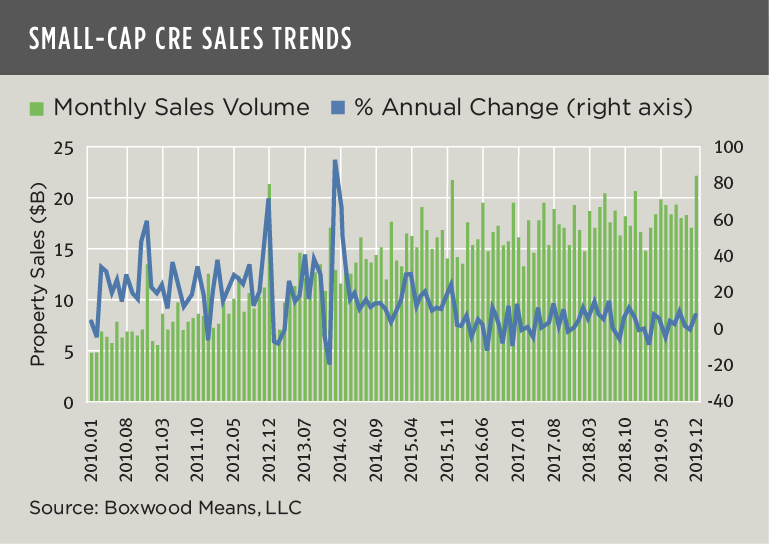
Strong deal flow produced a record year for sales in the small-cap CRE investment market. Buyers’ prodigious demand, inspired by relatively stable U.S. economic and real estate market conditions, also elevated asset prices to an all-time high. However, the current coronavirus pandemic may well interrupt or halt CRE’s long bull run.
Transaction volume for CRE assets under $5 million in value rose 1.6% YoY to a massive $217.1 billion during 2019 on a preliminary estimate basis. As shown in the nearby graph, property sales intensified over the 10-year time horizon as the economy stiffened, CRE space market conditions jelled and capital sources proliferated. While sales increased at a robust compound annual growth rate of 16.4% over the decade, we can also see that sales growth (the blue trend line) has fluctuated in a narrower band consistent with later-stage conditions spanning the last several years.
×
![]()
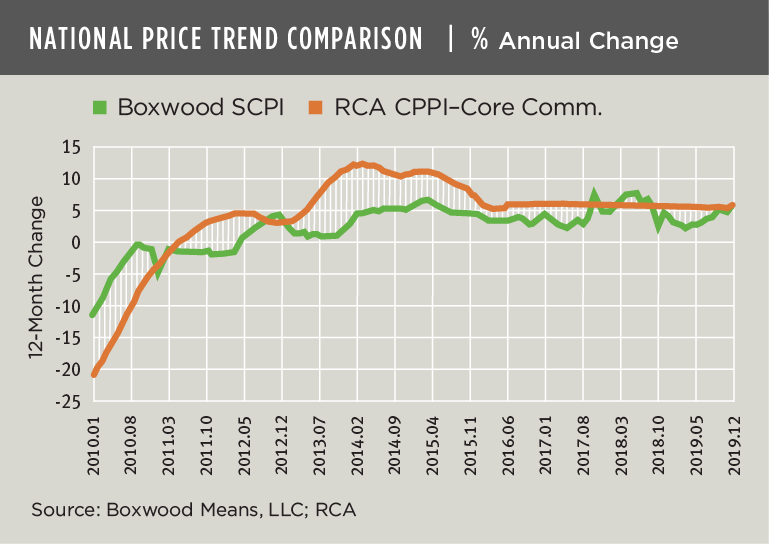
Nationally, asset prices echoed the exuberance of the sales market. Boxwood’s Small Commercial Price Index (SCPI) that tracks monthly sales in 163 U.S. metropolitan areas posted a healthy 5.7% gain YoY in December that was the best annualized return since the summer of 2018. As the nearby graph illustrates, small-cap CRE prices have matched price growth in large-cap CRE assets which increased 5.5% last year according to Real Capital Analytics’ Core Commercial Component CPPI (that excludes multifamily assets). As of December, we calculated that RCA’s Core Commercial CPPI was 11.1% above its prior 2007 peak. Boxwood’s SCPI ended the year 8.5% above its pre-recession apex.
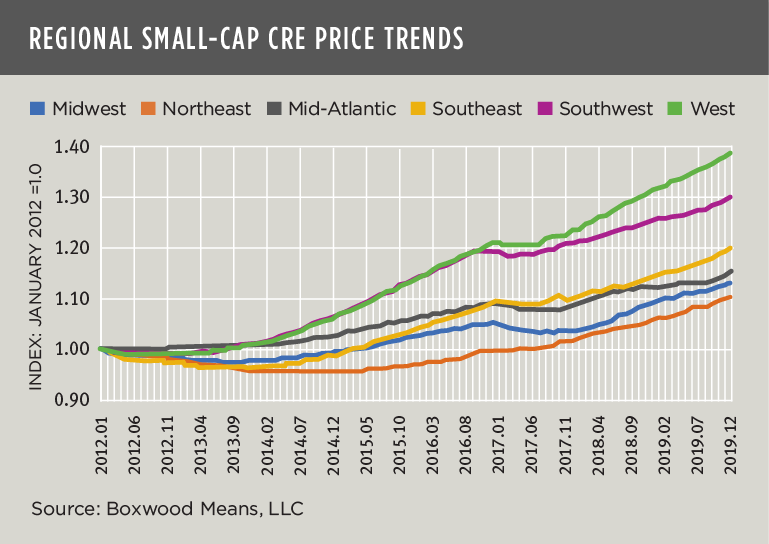
As we reported earlier, variations in regional economic growth produced sizable disparities in price outcomes across the six U.S. regions according to our research. Based on strong economic and demographic growth in the West and Southwest, compound annual price growth in these two regions through December rose 4.2% and 3.3%, respectively, since 2012 when the CRE market found its footing. The Southeast recorded 2.3% annual price growth while the Northeast (1.3%), Midwest (1.6%) and Mid-Atlantic (1.8%) regions trailed. See the nearby graph for regional price trends.
×
![]()
Yet, where we go from here is a big unknown. The traction of the CRE markets has loosened with the shock of the COVID-19 outbreak and attendant disruptions to supply chains. It seems almost certain that consumer spending and business investment will fall as a result.
The uncertainty surrounding the U.S. economic outlook now outweighs the threat we previously addressed concerning the future trajectory of small-cap CRE space market fundamentals. As we recently described elsewhere, aggregate leasing demand across industrial, office and retail sectors plunged last year, down 70% compared with 2018 to the lowest level since the fateful year of 2009, as both significant CRE supply and labor shortages for small businesses have largely arrested facility expansion and investment capabilities. This key supply-demand metric, as well as slowing rent growth, still cannot be dismissed. We must seriously consider that a downdraft on small-cap CRE market fundamentals will accelerate if the coronavirus outbreak is not contained soon.

