It might seem unthinkable that the multifamily market could turn sluggish after years of unrelenting growth, but that’s where we find it. Demand for small multifamily rentals has faltered and so have asset prices.
×
![]()
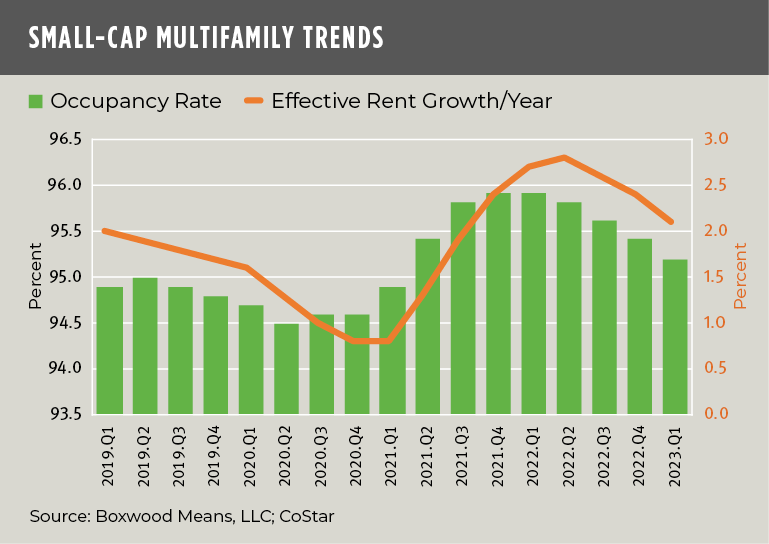
Boxwood’s Q1 analysis of national market performance indicated that absorption of small multifamily rentals was negative for a third quarter in a row. As the nearby graph shows, the U.S. average occupancy rate for these apartments of 5-40 units declined to 95.2% according to CoStar data, down 70 basis points YOY to the lowest level in two years.
One might reason that our tight labor market and strong employment growth should buttress multifamily demand. Yet the current, positive employment picture is partially obscured and undermined by weak wage growth. The fact is that when taking high consumer prices into account real average hourly earnings declined 0.5 percent, seasonally adjusted, in April from 12 months earlier according to the BLS. As a result, inflation has blunted the ability, especially of many low- and middle-income workers, to sign new leases. That said, cooling rents, down 60 bps YOY to an effective rent growth of 2.1%, may help to re-balance demand in the months ahead (see the rent trend in the same graph).
If it’s any indication of possibly better news arising for the small-cap multifamily sector, demand fundamentals for the apartment market overall recently turned back up according to Realpage.
×
![]()
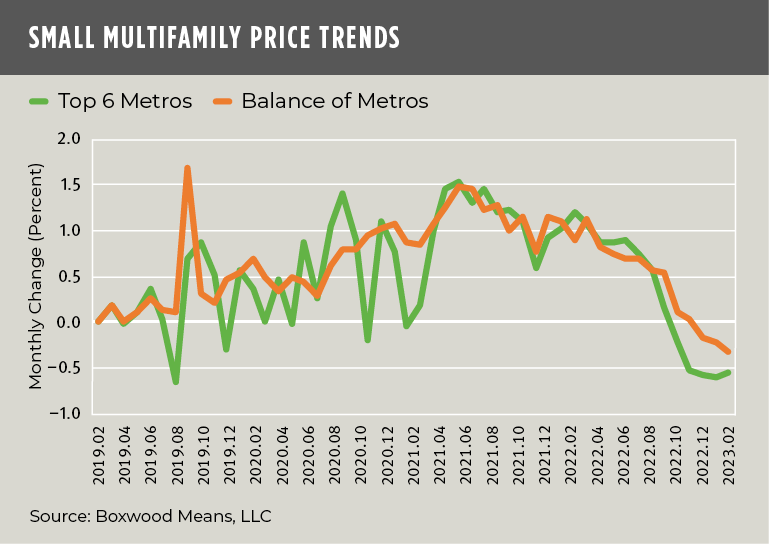
In the meantime, the weaker fundamentals combined with an unforgiving transaction market have triggered a decline in recent small-cap multifamily prices. Boxwood's national Small Multifamily Index (SMPI), that incorporates sales transactions below $5 million across 100+ metro areas, declined 0.4 percent in February for the fourth consecutive month. That projects to a -5.2% return on an annual basis. As shown in the nearby graph, the combined monthly return for the six most populous U.S. metros has dropped most prominently including a loss of 0.6 percent in each of the last three months. By contrast, the performance for the balance of metros, including small and mid-sized cities, declined at half that rate.
This differential, which is noteworthy for small-balance commercial lenders and investors, likely reflects the tendency of smaller metros, with some exceptions, to be less volatile in terms of rent and price growth during boom-bust cycles.

 Randy Fuchs