The high-flying small-cap industrial property sector plunged last year with a sizable drop in leasing demand. This was a remarkable turn of events for a sector that produced robust occupier growth repeatedly over the past 15 years. Industrial’s setback was also in stark contrast with the relatively stable, if not upbeat space market trends in the small-cap retail and office sectors. Indeed, with some favorable economic tailwinds blowing, there appears to be solid momentum ahead for the small-cap CRE domain.
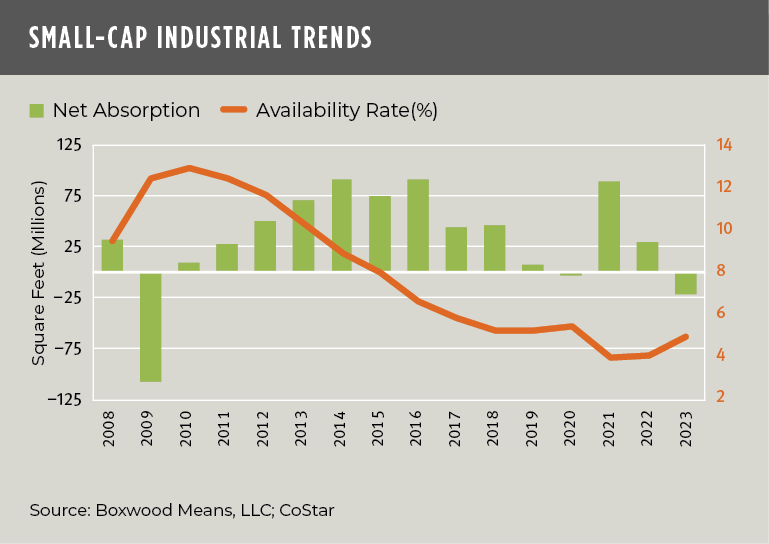
U.S. industrial net absorption fell in 2023 by 21.5 million sq. ft. punctuated by occupancy losses in every quarter. Aside from consecutive net occupancy deficits for the first three quarters of 2020 that culminated with a small annual shortfall thanks to the pandemic, notably this sector had not recorded a single annual loss since the 108 million sq. ft. of net negative absorption posted in 2009.
Slowing U.S. factory trends were likely a major factor in the pullback in small-cap industrial as manufacturing activity dipped in December for the 14th month in a row according to the Manufacturing ISM report by the Institute of Supply Management. As reported, new product orders continued to soften as higher financing costs and inflated prices stifled demand for new equipment. Other factors adversely impacting industrial leasing were a modest decline in manufacturing employment coupled with a sizable loss of 40,000 transportation and warehousing jobs per recent BLS payroll data.
×
![]()
As a result, as shown in the nearby graph small-cap industrial space availability (including direct and sublet space) jumped 20 bps to 4.9% by year end, the highest level since Q1 2021, largely because sublet availabilities increased by a hefty 6.1 million sq. ft. In lockstep, the average small-cap industrial vacancy rate edged up 10 bps to 3.5% during Q4, a sizable increase of 60 bps YOY.
Additional year-end statistics drawn from Boxwood’s analysis of national Costar leasing data involving small commercial properties under 50,000 sq. ft. include the following sector highlights:
-
Retail Delivered a Commanding Performance – Small-cap retail advanced last year with upturns in consumer sentiment and retail sales triggered by solid wage growth, declining inflation, and ebbing fears of a recession. Retail notched an increase of 32.6 million sq. ft. in demand which, though down more than 40% YOY, extended the string of annual net occupancy gains to 16 years. The national space availability rate ended the year where it started at 4.5%, just 10 bps from its record low earlier this past year, as total availabilities for local strip centers, community centers, and freestanding stores barely budged. Similarly, the small cap vacancy rate was anchored all year at a record low of 3.4%.
-
Office Contradicted the Narrative – While challenges to the office sector raise existential questions in some quarters because of soaring downtown vacancy rates and mounting refinancing risks, the small-cap office domain has skated passed these problems largely unscathed. As noted in a previous research piece, the general durability of leasing conditions among small office buildings stems from a couple of location-based advantages including a concentration within suburban neighborhoods where office workers have shorter commutes (and greater attendance), and whose tenants tend to have modest-term leases, smaller office footprints, and more affordable rents. These factors and the stickiness of hybrid work are principal reasons why small-cap office demand only marginally declined for the year (-1.4 million sq. ft.) and conspicuously ended 2023 with two consecutive quarters of net positive absorption. As a result, the office availability rate was steady at 8.4%, within 30 bps of its all-time low and, in further rebuttal to the sector’s overall doomsday narrative, the scant 6.5% small-cap vacancy rate was less than one-half of the total U.S. vacancy rate for the sector as a whole.
×
![]()
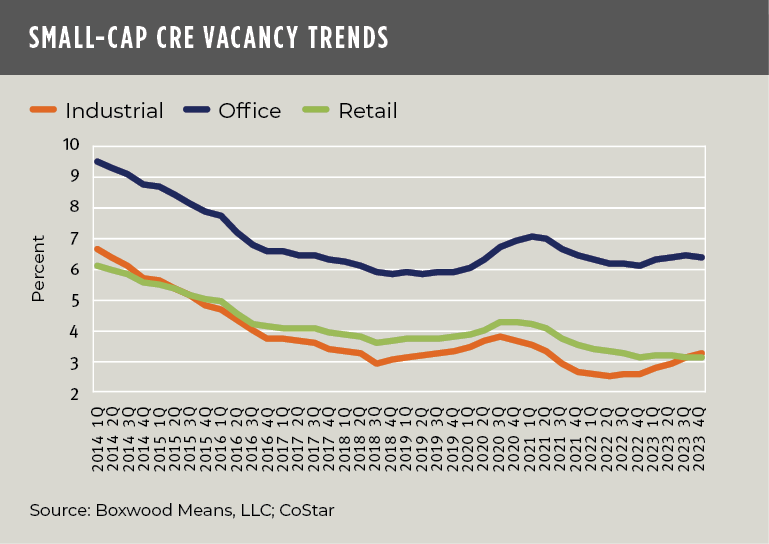
The trajectory of small-cap vacancy rates for the three property types is shown in the nearby graph. As you can see, despite industrial’s aberrant leasing performance last year, its national vacancy rate – as well as the others – are way below long-term averages. At these historically low levels, occupier fundamentals are not only rock solid, but also signal to lenders and investors that the smaller CRE domain is poised to deliver strong property income and asset valuation growth as the economy increasingly appears to have wheels down for a soft landing.

 Randy Fuchs