Surging retail sales lifted the retail sector to a preeminent position in the overall small cap CRE domain as its Q3 occupier fundamentals flourished. Retail’s ascendance occurs as the once-dominant industrial sector stumbled further while small office buildings held their ground.
×
![]()
Highlights from Boxwood’s national analysis of Q3 CoStar occupancy data involving small retail, industrial, and office buildings under 50,000 sq. ft. are cited below.
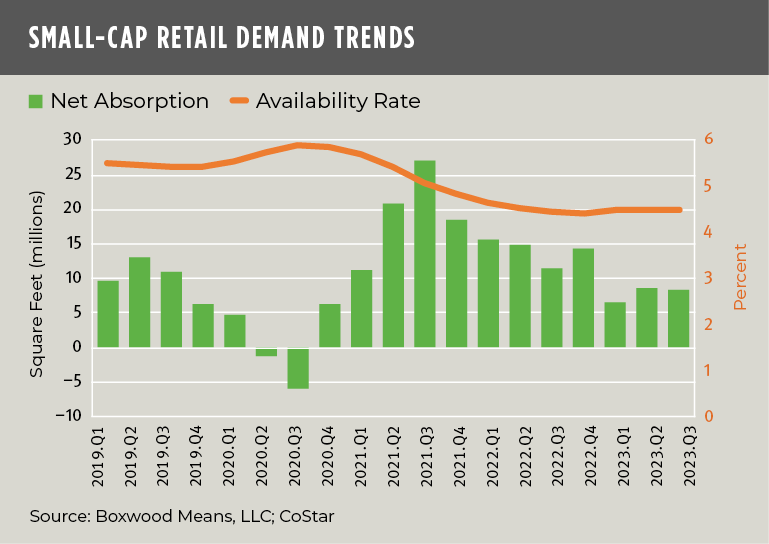
Revenge Retail Makes Its Mark. Retail sales rose a healthy, broad-based 0.7% in September and a robust 3.8% from 12 months earlier according to the latest report from the U.S. Census. With consumer spending running hot, resurgent retailers have continued to gobble up store space as a manifestation of – to turn a phrase – “revenge retail.” Demand increased by 8.4 million sq. ft. during Q3 extending a streak of 12 consecutive quarters of positive net absorption dating to the end of the retail store implosion in early 2021. (See demand trends in the graph nearby.)
Consequently, the small cap retail vacancy dropped 10 bps to 3.4%, on par with the lowest rate recorded late last year, while the availability rate steadied at 4.5% for the third quarter in a row and within 10 bps of its historical nadir. Another key driver of this extremely tight national market for small retail stores, strip centers, and street retail is the declining number of new, small cap shopping store deliveries which, YTD, matches the lowest level in 10 years. It comes as no surprise then that retail asking rents rose 3.9% YOY including a nearly 16% bump in rents since the pandemic initially hit home.
Resilient shoppers, buoyed by a strong labor market and personal earnings growth, have kept the U.S. economy humming. As such, we maintain a positive outlook on small cap retail which we first highlighted in a report over the summer.
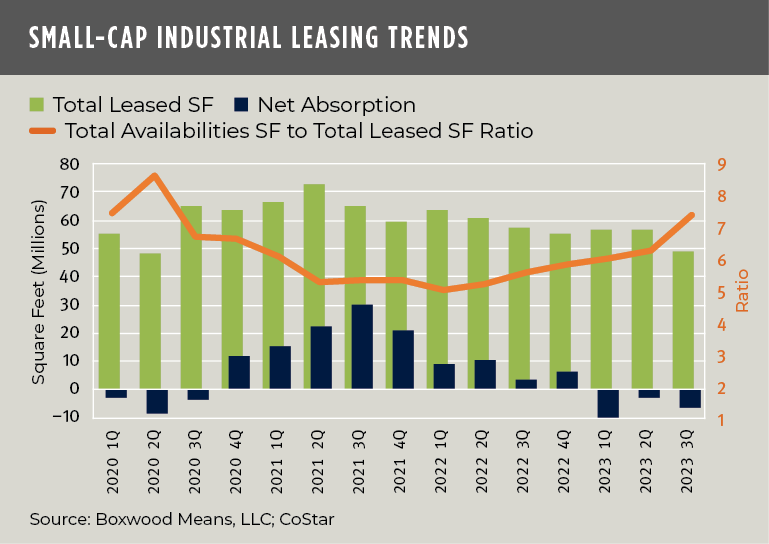
Industrial Suffers Withdrawal Symptoms. Fundamentals in the manufacturing sector, especially customer inventories and factory order backlogs, remained weak for the 11th consecutive month according to the latest Manufacturing ISM Report. Manufacturing output rose 0.4% in September, though the Federal Reserve reports it was 0.8% below the YOY figure. These mixed production indicators, combined with relatively weak imports of goods and services have led to sharply diminished industrial space requirements among small warehouses, light industrial, and flex facilities through Q3. Net absorption tanked by 6.1 million sq. ft., pushing absorption losses over three consecutive quarters to a YTD total of 18.4 million sq. ft. Notably, we have to look back to Q3 2009 –14 years ago during the GFC – for the last time that small cap industrial fundamentals suffered a similar (and more dramatic) setback in demand over the first nine months of the year.1
With this substantial downdraft, the national small cap industrial vacancy rate abruptly inverted and rose 20 bps to 3.4%. Similarly, total availabilities, stoked by sublet space expansion, jumped 30 bps to 4.8%, a level last witnessed a bit more than two years ago. (See the graph nearby that shows that leasing activity has trailed this year’s growth in space availabilities.)
×
![]()
That being said, don’t count industrial out yet. A silver lining here is that these occupancy rates remain comfortably below their long-term averages and thus offer some reassurance to lenders and investors that a deeper disruption in the small cap industrial market is unlikely, especially if industrial production stabilizes as the latest numbers might suggest.
Discordant Trends Persist for Office. CoStar’s Q3 statistics for the general office market further substantiate the concerns and wall of worry about this sector. For the national market at large, nearly 60 million sq. ft. of occupancy losses have accumulated so far this year, elevating the U.S average vacancy rate to a record 13.4% as structural changes in place of work continue to evolve. Ominous portent also derives from CoStar’s assessment that more than half of the leases signed before the middle of 2020 have yet to expire and will inevitably result in more excess space spilling onto the market.2
By contrast, the small cap office market, representing roughly half of the office sector’s total national inventory of 8.4 billion sq. ft., has so far safely navigated these hazardous seas. As we reported last spring, small office rental buildings generally offer more stability due to specific preferences among small firms for modest-sized footprints and shorter lease terms. These features, combined with the predominant suburban location of smaller buildings, promote cheaper, more affordable rents. These leafy locations also provide commuting employees with an additional perk: working close to home, which is correlated with higher in-person office attendance.
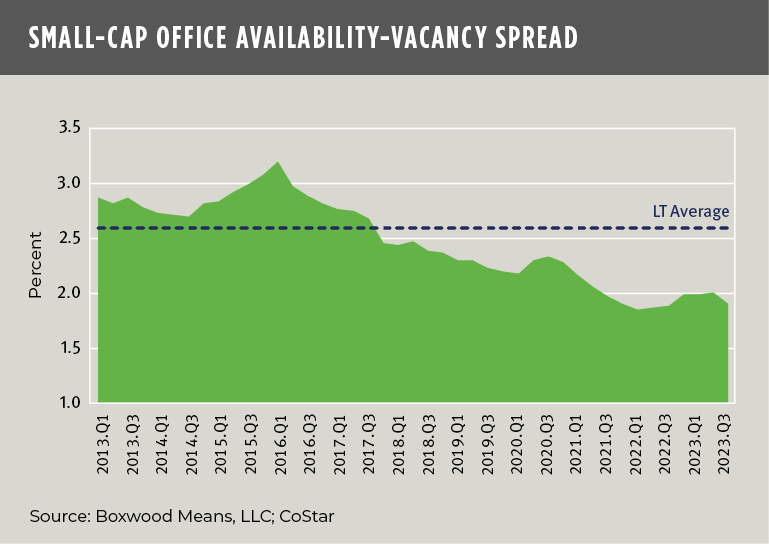
As a result, the dichotomy and differing risk profile between large and small cap office couldn’t be starker. Small office buildings enjoyed a near record low Q3 vacancy rate of 6.5% that was unchanged for a third consecutive quarter, complemented by an 8.5% availability rate hovering just 40 bps above its all-time low from a year ago. Though cumulative net absorption through September equated to a negative 4.3 million sq. ft., the sector actually eked out occupancy gains of 1.2 million sq. ft. in the latest quarter with an assist from more sublease deals. (The tightness of this leasing market is illustrated by the progressively narrowing spread between the office vacancy and availability rates in the graph nearby.)
×
![]()
All in all, these trends reveal dynamic shifts in small cap CRE occupier trends underscored by a changing of the guard: i.e., from industrial, the perennial powerhouse and prohibitive favorite for years; to retail, whose momentum since the beginning of the post-pandemic recovery has only accelerated and delivered consistently superior results in 2023. And, while comparatively healthy small cap office fundamentals are overshadowed by the widespread turmoil in the office market at large, the substantial outperformance of small office buildings won’t be lost on savvy lenders and investors in the space.
So, while important sectoral shifts are noted here, the bigger picture is that despite all of the disturbing public discourse about growing commercial property distress and plunging valuations among other worries, the latest occupier market data indicate that small cap CRE is uniquely positioned to ride out any impending market upheaval because the domain’s underlying operating fundamentals are relatively strong and durable. Consequently, small cap CRE assets are, generally speaking, likely to continue supporting stable property-level net operating income and asset valuations.

 Randy Fuchs