×
![]()
Popular wisdom is that national commercial real estate prices have reached new heights in the post-financial crisis era. This view was recently boosted by the Federal Reserve Chairman, Janet Yellen, who signaled that CRE prices were "high," while other Fed officials expressed similar concerns about over-heated markets.
To combat the potential for asset price bubbles, Federal officials say they are leaning towards enhanced financial supervision of commercial banks and thrifts. That's all well and good. But if the Fed believes the magnitude or breadth of CRE asset inflation is accelerating, it's conceivable that monetary policy will be further tightened leading to a faster pace of interest rate increases that would likely be damaging.
Given the potential risks at stake here, it behooves Federal officials and industry pundits to pick their measurement tools wisely. The single best gauge of CRE investment conditions is surely not the number of construction cranes on the skyline of gateway cities like Los Angeles, New York or Seattle. Equally nonsensical is it to rely entirely on metrics that capture the price performance of just one investment class, such as property trades solely of large institutional properties.
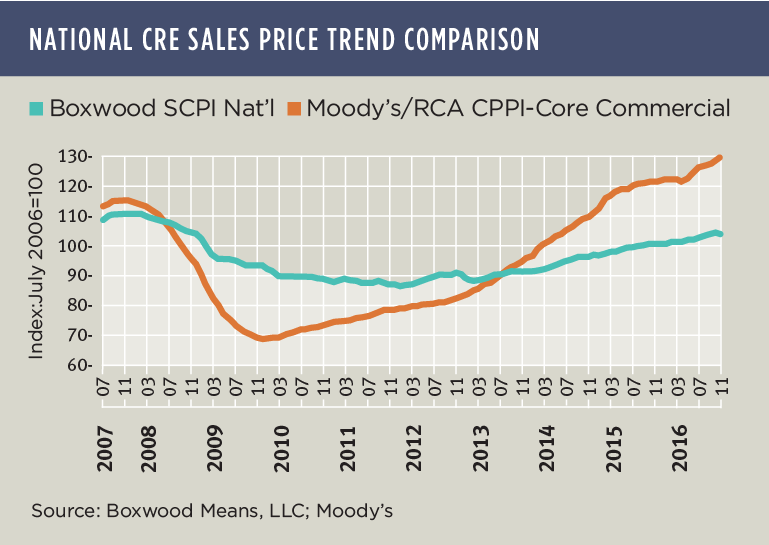
But it wouldn't be the first time that has happened. Ten years ago we argued that the 40% drop in CRE prices during the financial crisis, as consensus opinion had it, was only partially true because that assessment was heavily influenced by the popular and well-respected Moody's/RCA CPPI focused on institutionally-oriented asset sales principally above $2.5 million. (Full disclosure: we are big fans of RCA and, as illustrated here, often employ the CPPI metrics for comparison purposes.) As counterpoint, Boxwood's market research indicated that within the more extensive small cap CRE domain involving assets under $5 million in value the peak to trough price decline was much less steep, at 29%.
This 1,100 basis-point gap underscored the sizable difference in asset price volatility between the two domains which, at the time, went largely un-noticed by bank regulators and market analysts alike. As a result, commercial properties of all sizes - but especially those on Main Street America - were unnecessarily held hostage to the austere mortgage lending regime that ensued.
Today we can agree on the following: that institutional prices are generally elevated; there are bubble-like conditions in a handful of cities; and apartment prices are generally frothy. But we disagree that these conditions are necessarily concerning and, more importantly, that they fairly represent investment conditions broadly - nor specifically in the small cap CRE arena.
Let's initially look at some institutional price trends. As of December, Moody's/RCA CPPI Core Commercial Index had gained a hearty 8.2% year over year catapulting asset values by 14.1% above the former peak level achieved during the fall of 2007. Core Commercial prices cumulatively have increased by a whopping 67.6% over the last five years. Note, however, that there was a distinct slowing in the rate of appreciation during 2016 compared with the previous 12 months when double-digit annualized price gains were the norm. RCA attributes the price deceleration to the credit issues at the beginning of last year, challenges in the CMBS market and a slowdown in the number of megadeals.
This easing of price growth was also evident in cities often synonymous with bubble territory. While Core Commercial prices soared over the last three years in San Francisco (52.4%), Seattle (41.9%), Manhattan (31.7%) and Boston (27.8%), with the exception of San Francisco annual returns last year slowed to a crawl. So a commercial bubble in prominent metros appears to be contained at the moment.
That being said, certain segments of Core Commercial like CBD Office and Industrial showed renewed strength during the fourth quarter and may bear watching. And, of course, the institutional Apartment sector has been on an extended tear with cumulative price appreciation of 91.4% over five years. Furthermore, a robust 11.4% annual return in December also highlights that favorable apartment demand trends continue to outstrip supply and are sustaining strong flows of both domestic and foreign capital into this property type.
Outside of the Apartment sector though, market risks in the large cap arena seem manageable, and cautionary flag waving by Federal officials seems unwarranted at this time. It is even more premature when we consider price trends within the broader category of small commercial real estate.
Indeed, Boxwood's national Small Commercial Price Index (SCPI) that tracks sales of commercial properties under $5 million in value across 120 markets tell a very different story: Prices rose by only 3.3% year over year (through November) and remain 6.2% below the previous cyclical peak in late 2007 (see the nearby graph). The fact is that these smaller assets, typically represented by Class B- and C-grade quality buildings a sizable portion of which are owner-occupied, are not touched or galvanized by global capital. Instead, local capital tends to drive these trades, especially in secondary and tertiary markets. Also, over 100 of these smaller markets are covered by Boxwood's national Index which helps explain the subdued but more inclusive U.S. price performance.
This is not to say that small cap CRE prices uniformly lack luster. In total, 104 of the 120 markets posted positive annualized returns during November including 37 that exceeded yearly gains of 5% or more, led by Vallejo (11.7%) and followed by Sarasota (11.6%), Fort Myers and Fort Lauderdale (9.7%), and Miami and Las Vegas (9.6%).
Yet commercial prices in only 19 cities (led by Greeley, Tulsa, Scranton and Houston) have recovered more than 100% of their respective losses from the financial crisis. Which means that prices in 100 markets are still below their former peak and arguably pose little threat to overall market stability.
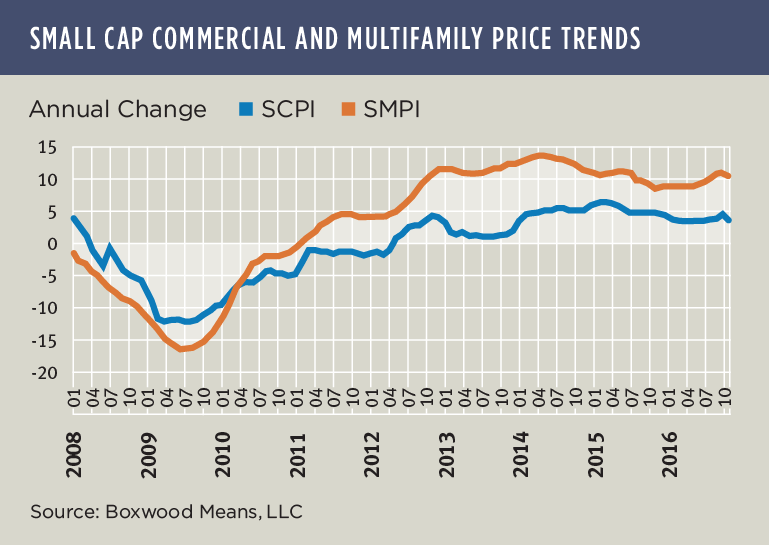
The same might not be said for small cap apartment prices (see the nearby graph). Boxwood's Small Multifamily Price Index of 40 markets surged 10.1% year over year in November and topped its previous peak by 28.1%, precipitated by high levels of tenant demand for affordable rental housing as well as a funding bonanza for small-balance multifamily borrowers sponsored by Freddie Mac and Fannie Mae.
The same might not be said for small cap apartment prices (see the nearby graph). Boxwood's Small Multifamily Price Index of 40 markets surged 10.1% year over year in November and topped its previous peak by 28.1%, precipitated by high levels of tenant demand for affordable rental housing as well as a funding bonanza for small-balance multifamily borrowers sponsored by Freddie Mac and Fannie Mae.
