Last year’s halt to accommodating interest rates by the Federal Reserve, punctuated chiefly by a series of extraordinary increases in the fed funds rate targeting deepening inflation, has curbed the CRE market’s expansion and long-standing stability. The winds have perceptibly shifted, now exposing investors and lenders to potentially widespread market and collateral risks unseen for about a decade notwithstanding the pandemic’s interregnum.
So far in this transition phase, the CRE damage appears to be minimal in terms of loan delinquencies, defaults, and distressed sales. But with the doubling in commercial mortgage rates from last year, a more obvious, albeit slow-moving reveal is the major slump in CRE lending (with perhaps the exception of the Agencies). Higher capital costs have frustrated the intentions of borrowers and killed countless deals. Anecdotally, many bank clients tell us their deal volume is about half of what it was last year. Couple this waning loan volume with a pullback in the investment sales market, and the CRE market writ large may be heading towards further disruption or even recession in 2023 – possibly in tandem with the US economy as a whole.
×
![]()
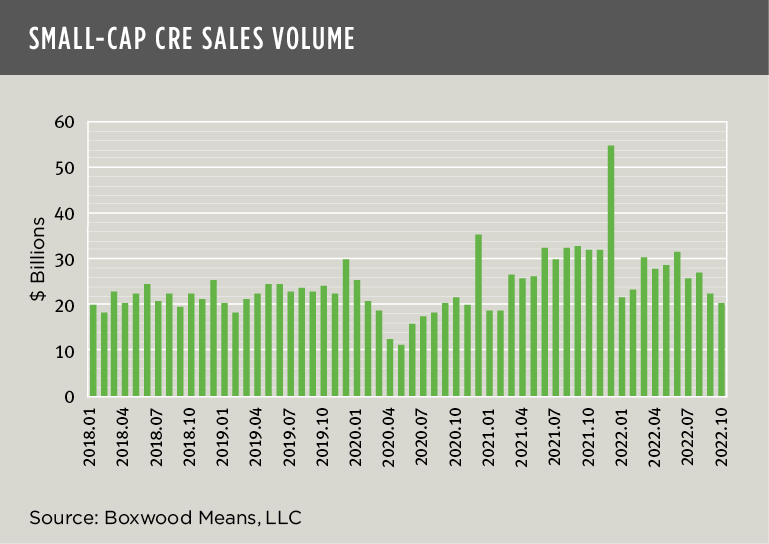
Of central concern to lenders and investors, and perhaps the main trigger for much of today’s market uncertainty, are CRE collateral values. With far fewer comparable transactions in the marketplace, asset valuations have become challenging. Indeed, Boxwood’s research indicates that small-cap CRE transaction volume under $5 million in value plummeted 37% YOY in October to the lowest monthly total in nearly two years. (See the nearby graph.) Similarly, MSCI Real Assets (formerly RCA) reported that deal volume for principal transactions above $2.5 million dropped 21% versus the same period in 2021. Layer on shifting cap rates and less predictable property income, and we have increasingly poor visibility on prices.
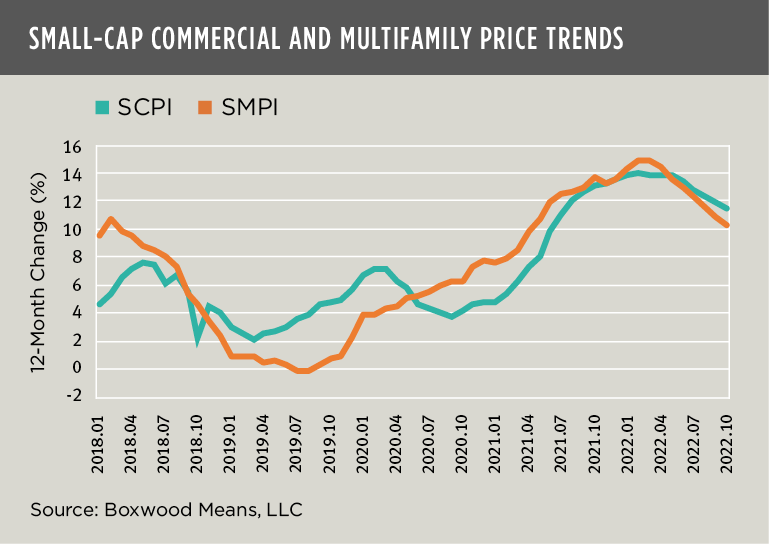
Buyers and sellers may be in a stalemate over today’s valuations, but there’s no doubt asset prices are tipping over. Take a look at the second graph nearby, and you’ll clearly see that though small-cap commercial prices were still appreciating late last year – at an 11.5% annual clip during October – the trend in Boxwood’s National SCPI for commercial properties was ticking down considerably. That is, double-digit increases had declined for five consecutive months including a 210-basis-point drop since January of last year.
×
![]()
In addition, Boxwood’s National SMPI that tracks small multifamily prices posted a 10.2% increase over 12 months but exhibited similar diminishment with a 330-basis point loss over the first 10 months of last year. Moreover, as a more forward-looking indicator of the trajectory of Boxwood’s indices, the 0.7% monthly increase in both SCPI and SMPI during October, when annualized, amounted to a relatively earthbound 8.7% rate of growth.
Of note, MSCI’s RCA CPPI also showed erosion in price gains. The RCA Apartment Index increased 11.3% YOY through October, but that figure pales in comparison with the 22.5% annual increase realized in January of 2022. In addition, the progression of RCA’s Core Commercial Index lost significant momentum, from an annual return of 17.4% as of last January to only 6.1% by the beginning of Q4.
If there is one, the silver lining to a painful, absolute decline in property values will be some restoration in market equilibrium and improved market liquidity assuming, of course, that interest rates level off and the economy avoids a tailspin.

 Randy Fuchs