×
![]()
After more than a year of pandemic-induced shocks to the U.S. economy and the CRE markets, healthier small-cap occupier markets are coming back into better balance with an investment market that has barely missed a beat.
Space Market Trends
Below are the key takeaways from our analysis of CoStar Q2 CRE data tracking U.S. inventory of for-lease buildings below 50,000 sq. ft.
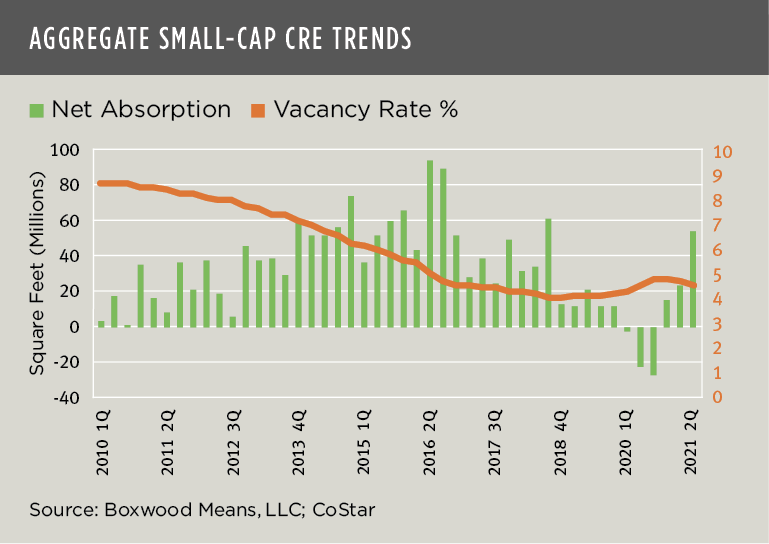
- Net absorption shifted into higher gear. Net absorption rose for the third quarter in a row to 53.5 million sq. ft. across industrial, retail and office sectors as small business employment continued to expand. As the nearby graph shows, aggregate demand was more than two times the volume of Q1 while posting the best increase in 12 quarters.
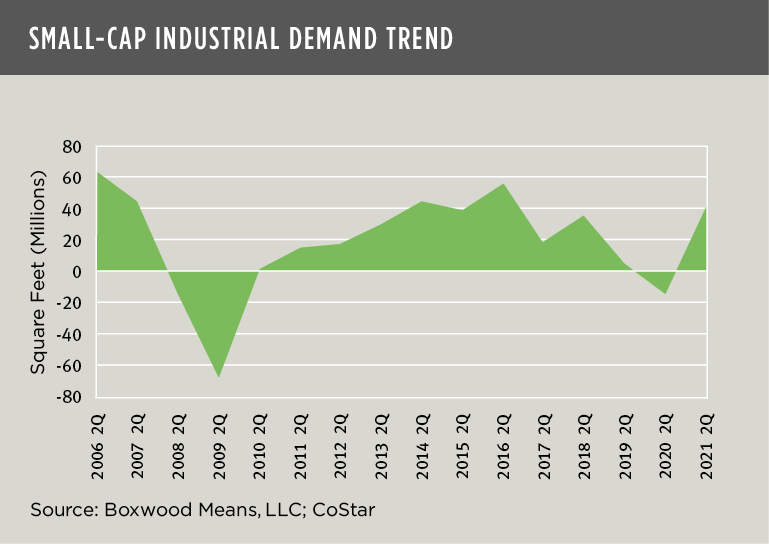
- Industrial demand is red hot - again. Demand surged as Manufacturing (2.7% growth YoY thru June), and Transportation and Warehousing (7.4%) produced a net gain of 713,000 jobs since last June. With the employment rally, Q2 space occupancies jumped by more than 50% to 24.9 million sq. ft., and the 41.1 million sq. ft. of net absorption over the 1H was the fourth highest amount for the same period in 16 years. (See the nearby graph.) As a result, industrial vacancies plummeted 30 basis points (bps) to 3.3% nearing the record low of 3.0% set in 2018. Additionally, total space availabilities dropped a hefty 50 bps to 4.6% which is the lowest level since at least 2006.
×
![]()
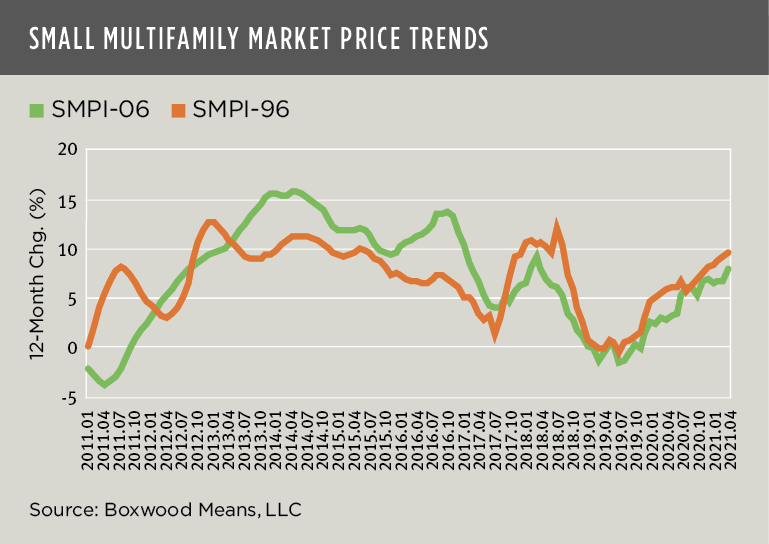
- The office sector mounted a respectable comeback. After five consecutive quarters of net occupancy losses – the longest string since at least 2006 – small-cap office demand rebounded with 8.5 million sq. ft. of positive net absorption. That reflects the best quarterly gain in three years. That said, office markets are still on shaky ground. The national office vacancy rate eased 10 bps to 7.1%, still the highest rate in five years and, though Q2 total availabilities declined 20 bps to 9 .3%, only one million sq. ft. of sublet space was removed from an extremely high level of sublease inventory nationwide. (See the nearby graph.)
The question remains whether a major transformation in office use is underway, or if tradition wins out and the hordes of city dwellers and commuters return to their central office facilities. To date, the outlook is murky and unsettled. For instance, according to Kastle Systems’ occupancy report that tracks key swipes in 2,600 buildings in over 100 cities, the average occupancy across 10 major cities was 31.0% in early July, rising roughly a very modest 10 points compared with 12 months earlier.
Employers have a unique opportunity to rethink what the workplace needs to be and where. This observer believes C-suite execs need to emphasize flexibility over top-down managerial control. Focus on and invest in the true drivers of worker motivation and productivity – wherever it takes hold – and not rely on command-control imperatives or abstract notions about the primacy of organizational culture and brand to justify a wholesale pilgrimage back to the office.
If open-minded, employee-centric thinking prevails, it seems hard to imagine that the future CBD office ecosystem will ever be quite the same.
×
![]()
- Retail fundamentals beat expectations. For a sector whose general demise has been widely exaggerated, its resilience was convincingly affirmed during Q2. Retail occupancies rose 20.1 million sq. ft., roughly double the level over Q1 and the best quarterly performance in almost three years. The national vacancy rate dropped 20 bps to 4.3%, returning to the level of a year earlier, as retailers leased up space in support of robust 5.5% YoY growth in retail trade employment (totaling a bit over 800,000 jobs). In addition, total space availabilities narrowed by 30 bps to 5.6% - matching the lowest level on record – with a strong contribution from increased sublet deals.
Price Trends
Below are the key results of Boxwood’s latest proprietary research on small-cap CRE price trends involving commercial and multifamily assets under $5 million in value.
- Small-cap CRE price growth reverts to pre-Covid form. Boxwood’s national Small Commercial Price Index (SCPI) covering 160 metro areas advanced for the seventh month in a row to an annualized rate of 6.9% in our most recent April reading. This growth rate is only 30 bps below 2020’s best annualized performance (7.2%). During the pandemic, positive rate advances slowed for six consecutive quarters starting in April, but neither property values or investment conditions ever deteriorated compared with the upheaval witnessed in the occupier space.
- Investment sales volume bounced back. Asset prices were buoyed as small business owners and investors got back in the game. Sales of small-cap commercial properties (excluding multifamily) topped $16 billion in April, a sizable 41.4% increase YoY (driven in part by the low 2020 comparison period). Transaction volume of $68 billion YTD is off by 3.0% versus the corresponding four-month period last year.
×
![]()
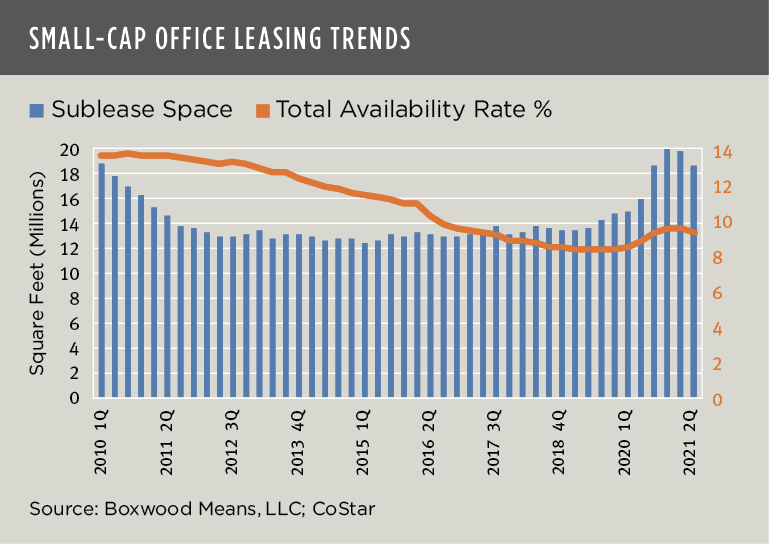
- Smaller multifamily markets have outperformed. Recent vigorous growth in Boxwood’s national Small Multifamily Price Index (SMPI) underscores the impact of perpetual, outsized demand for affordable rental housing on investment values. Tracking 102 metro areas, SMPI’s 9.0% increase YoY during April was the highest 12-month gain in three years. Since the end of the Great Financial Crisis, SMPI has swelled by 118.1%. Excluding the six largest U.S. population centers, the balance of multifamily markets (SMPI-96) produced only a slightly lower return since the end of the financial crisis, or 116.0%, as these relatively smaller markets outpaced the big six markets for a couple of years running including the latest annualized gain of 9.9%. (See the nearby graph.) The best multifamily market performers over 12 months include Charlotte (11.0%), Phoenix (10.7%), Boston (10.6%), and Columbus (10.3%). In all, 97 of the 102 markets posted increases YoY.
Clearly, smaller markets are having their day(s) in the sun. Not only is this evident in the smaller multifamily metro areas but, beginning this year, this pattern of price outperformance has emerged among the smaller commercial markets, too. The overall stability of the small-cap CRE investment market over the past year was largely sustained by flush capital markets and the propensity of small-time investors to hold their assets over a long period. As a result, asset price growth persisted. By contrast, the pandemic shocked the space markets and destroyed way too many Main Street businesses despite federal loan programs aimed at curbing the damage. Now, as Main Street continues to recover, the small-cap CRE investment market has raised the ante.

 Randy Fuchs