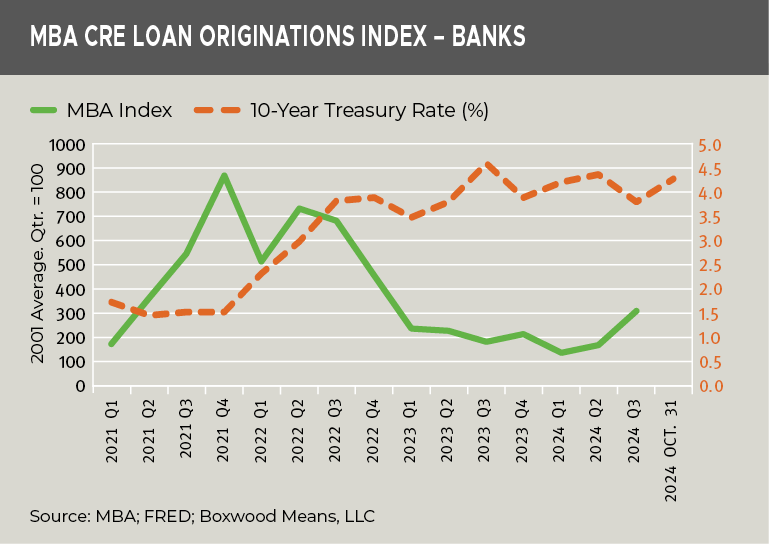
Earlier this month, the Mortgage Bankers Association (MBA) reported a surge in commercial real estate (CRE) lending during the third quarter, buoyed by declining interest rates. This marked a notable improvement in bank lending activity, according to MBA’s Commercial/Multifamily Origination Index, which soared 69% year-over-year (YOY) and 86% from the prior quarter.
On the surface, these numbers seem promising. However, a closer look reveals that this surge may overstate the significance of the rebound. That is, a favorable comparison to weak CRE lending over the past two years provides important context1. (See the graph nearby.) Beyond these headline figures, recent CRE loan performance metrics suggest that banks still face substantial challenges to achieving sustained momentum.
×
![]()
Obstacles to Robust CRE Lending
Two primary factors continue to hinder a broad-based recovery in CRE lending by banks: rising interest rates and increasing volumes of troubled loans.
Treasury yields have surged recently on fears of a return to greater inflation, driving up borrowing costs for CRE loans. Higher rates exacerbate financing challenges for borrowers, both in securing new loans and restructuring existing debt. This adds another layer of difficulty for banks aiming to grow their CRE portfolios.
Second, the growing burden of non-performing loans, particularly in the non-owner-occupied (NOO) CRE space, poses a significant hurdle. NOO loans, which account for nearly half of the $2.5 trillion in total bank CRE loans (including NOO, owner-occupied, and multifamily groups in this analysis), are critical indicators of the sector's overall health.
Many banks have relied on the "extend and pretend" strategy, last seen during the Global Financial Crisis, to manage problem loans. By extending loan maturities in hopes of future interest rate relief, banks aim to avoid immediate losses. However, this approach has drawn criticism. The New York Federal Reserve recently highlighted the risks of this strategy, noting in its report that these tactics contribute to credit misallocation and the creation of a “maturity wall” of troubled loans that strain banks' lending capacity.
Key Loan Performance Trends
Recent data suggests that banks are beginning to address these challenges more proactively, but significant headwinds remain.
Non-Performing Loans
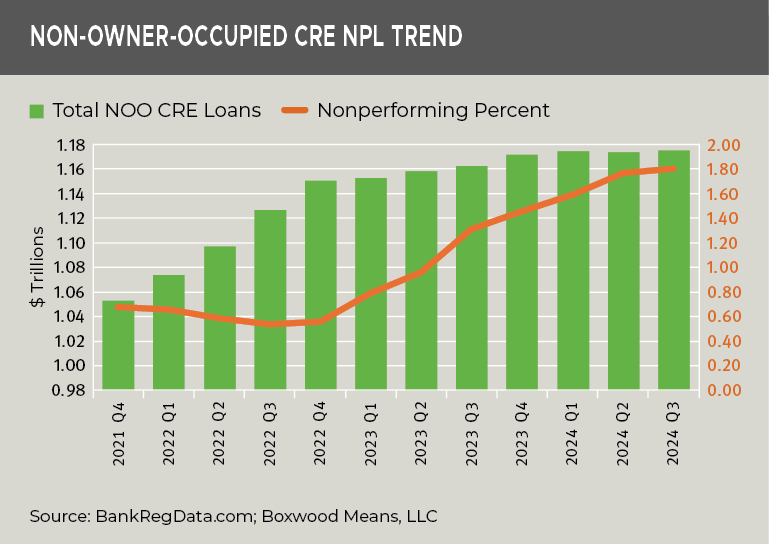
Non-performing NOO loans (defined as loans 90+ days past due or on non-accrual status) have risen to a four-year high of $21.1 billion, equating to 1.8% of total outstanding loans in this category. (See the next graph nearby.) This is the highest non-performing loan percentage among all bank asset types, surpassing home equity loans and credit card debt (both at 1.7%).
Yet it’s noteworthy that this problem is concentrated among large banks. Approximately 80% of the $21.1 billion in non-performing NOO loans, or $16.6 billion, is held by the 49 largest banks (those with assets exceeding $50 billion)2. Many of these large institutions have struggled with delinquent loans tied to large office buildings and other high-value properties, which have seen declines in asset values3.
×
![]()
Loan Modifications
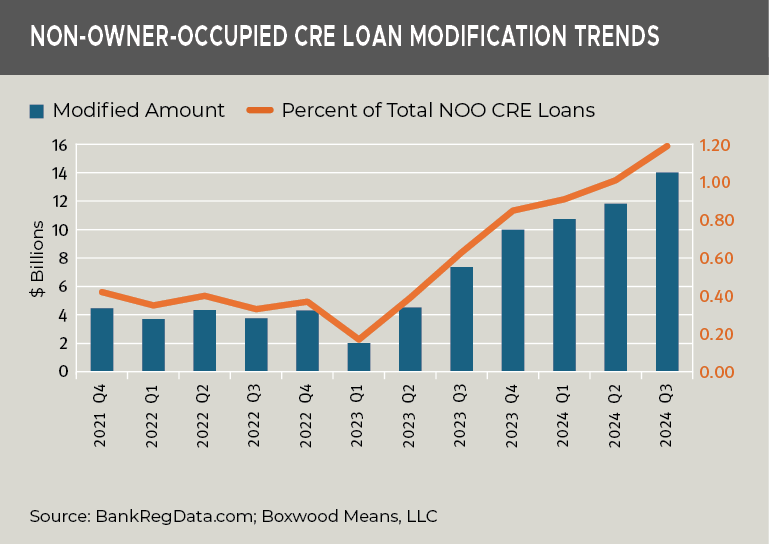
Modified NOO loans—formerly referred to as troubled debt restructurings (TDRs)—have also spiked. During Q3, the percentage of modified NOO loans rose by 18 basis points (bps) from Q2 and 56 bps YOY to 1.19%4. This doubling of modified loans to $14 billion in a year signals an increased focus by banks on restructuring problem loans. See the graph nearby.
While these modifications provide temporary relief, their long-term effectiveness remains uncertain. Bill Moreland, a bank analyst and owner of BankRegData.com, cautions that many borrowers initially meet payment requirements but face renewed difficulties in subsequent years, especially during economic downturns. He also suggested that “modifications done in moderation can be helpful; however, once a bank gets addicted to the process, they are likely only delaying the problems and increasing the likelihood of future delinquencies.”
Charge-Offs
Charge-offs further highlight the growing strain on CRE portfolios. NOO charge-offs totaled $1.4 billion in Q3—more than double the $747 million recorded a year ago and a staggering 11-fold increase from Q3 2022. The average charge-off rate for NOO loans rose to 0.46%, up 20 bps YOY. Similar to non-performing loans, the bulk of these charge-offs (80%) were concentrated among the largest banks5.
×
![]()
The Challenge for Smaller Banks
While large banks bear the brunt of troubled NOO loans, smaller banks are not immune to risks. Community and regional banks, among them the roughly 1,700 institutions with assets between $250 million and $100 billion as reported by BankRegData.com, often have high CRE concentration ratios – in fact, 4-5 times those of the largest institutions. Notably, while this broad group of smaller banks may currently report relatively lower rates of non-performing loans compared with their larger brethren, these high concentration ratios indicate that there is significant forward-looking risk embedded in their CRE portfolios.
As a result, many smaller banks with high concentrations and fragile loan portfolios have pared back their CRE exposure by limiting new credit issuance. Yet. this cautious approach only further stifles the prospects for a broad-based recovery in CRE lending.
Looking Ahead
Despite the latest, encouraging uptick in CRE loan originations by banks, the path to sustained growth in CRE lending faces significant hurdles including rising interest rates, a mounting maturity wall of troubled loans, and the overexposure of many smaller banks to the CRE market.
While some loan performance metrics suggest banks are taking steps to address these challenges, the broader picture remains uncertain. Until banks can navigate these headwinds, the prospect of a robust recovery in CRE lending appears elusive.


 Randy Fuchs


