What a year. Powerful market fundamentals overcame Covid-induced uncertainties last year and paved the way to record growth in small-cap commercial and multifamily property prices.
Unprecedented demand was a common denominator driving asset prices. Occupancy rates of market-rate apartment rentals units reached a new peak, while the aggregate small-cap national vacancy rate across office, industrial, and retail properties plunged to the lowest level since at least 2006 amidst soaring leasing activity by small business tenants.
Small Multifamily Price Trends
×
![]()
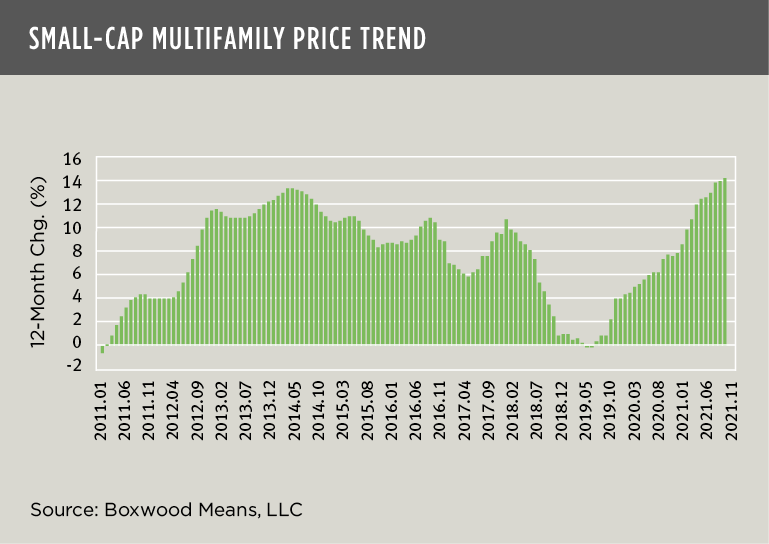
Small multifamily property prices closed out last year with double-digit annual growth for an eighth consecutive month that was capped by a record 14.2% YOY increase in December according to Boxwood’s Small Multifamily Price Index (SMPI) that tracks property sales under $5 million. (See the nearby graph.) Since the outbreak of the pandemic two years earlier, the National SMPI rose a considerable 23.0%, notwithstanding concerns among property owners and investors that many households would have trouble meeting rent obligations, especially considering the massive job layoffs so many people endured. But it turned out that residential occupancy rates remained relatively steady thanks to the federal government’s economic stimulus, aka CARES Act and, of course, because of persistent undersupply of affordable new housing rentals. This last factor was the primary driver behind SMPI’s robust 7.7% average annual growth rate since the end of the GFC.
As discussed in a previous blog piece, a separate telling aspect of last year’s small multifamily price trends was the outperformance of smaller markets compared with the six largest metro areas. With a 14.9% YOY increase in December, multifamily prices in secondary and tertiary markets eclipsed the biggest metros by a margin of 130 basis points. In fact, since 2020 smaller markets have consistently outpaced the biggest metros month after month as remote work fueled relatively greater demand for housing in outlying cities.
Small Commercial Price Trends
×
![]()
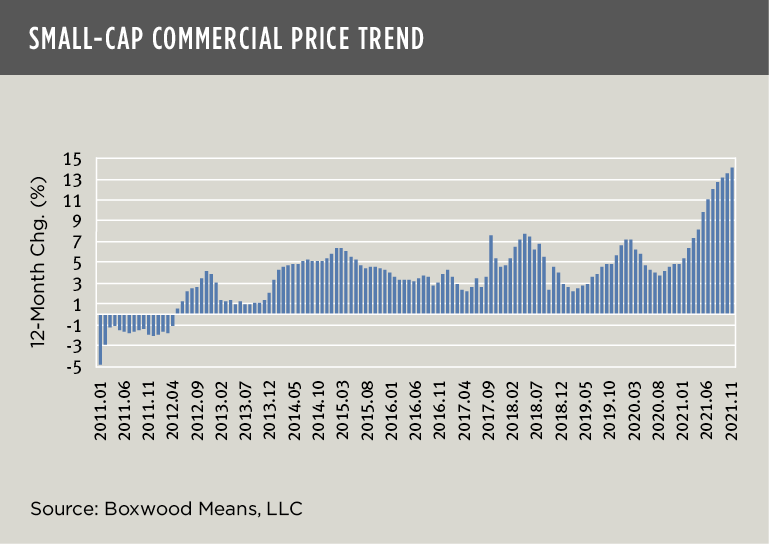
Small-cap commercial prices followed a similar elevated trajectory. Boxwood’s National Small Commercial Price Index (SCPI) grew by double digits every month since last June culminating in a record-breaking 14.1% increase during December. As the nearby graph shows, this price surge was unprecedented for small commercial properties over our historical time series and underscores the substantial impact that a rebounding small business sector had on investor demand for small-cap office, industrial and retail assets. No doubt the Fed’s Paycheck Protection program, which handed out almost 11.5 million individual PPP loans stabilized many small businesses and the CRE market at large, and thus kept the collective appetite of small-balance lenders and investors whetted downstream.
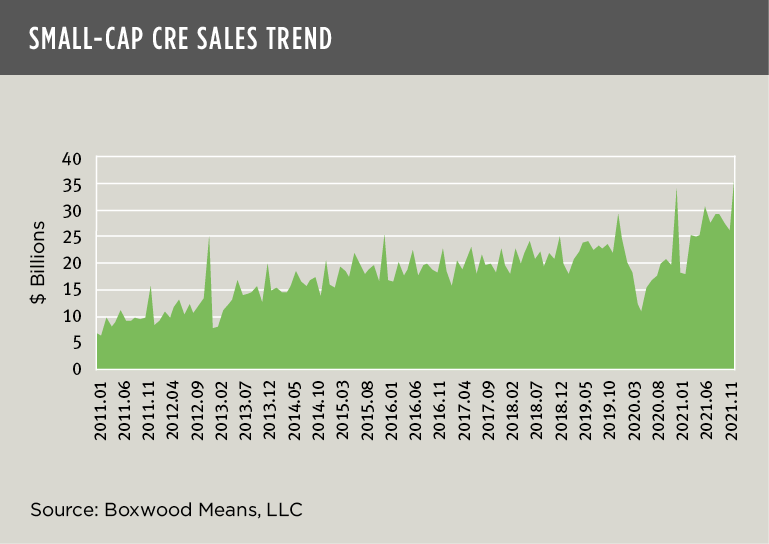
Indeed, investors ploughed a massive $319 Billion into small-cap CRE assets last year, an all-time high and 39% above than 2020 level. (See the last graph.) The result: National SCPI surged 19.6% in two years since the Covid outbreak – in sharp contrast with the more ordinary 3.8% average annual growth rate since the end of the GFC.
In a year filled with pandemic-induced uncertainties and mid-course corrections of all kinds, the CRE market turned out to be a thriving sanctuary for investors and lenders.
×
![]()

 Randy Fuchs