×
![]()
A fourth quarter rally in small-cap CRE leasing demand raises hopes for a revival of the Main Street economy and an improved outlook for small-balance lenders and investors.
After 11 months of small business disruption and closures caused by the pandemic, a Q4 turnaround in small-cap CRE space demand may signal renewed owner confidence in the small business economy. Granted, the NFIB’s latest research suggests that small business owners are not anticipating better business conditions over the next six months. Furthermore, after the bleak CRE results of Q3, we might rightly expect a slow recovery. But the recent reality is that small firms are hiring workers and signing leases. And the new administration’s commitment to federal COVID relief and stimulus, and plans to revive the economy and boost vaccine manufacture and distribution will all have a positive impact for the Main Street economy and CRE.
Space Market Trends
Here are key takeaways from our analysis of CoStar data covering U.S. inventory of for-lease buildings under 50,000 sq. ft.:
×
![]()
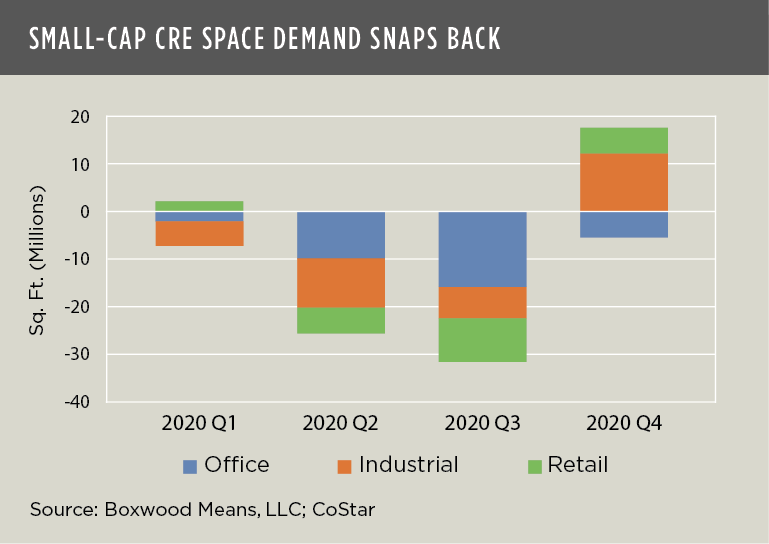
- Net absorption across industrial, retail and office sectors sprang into positive territory during Q4, halting a slide in demand for three consecutive quarters witnessed only one other time over the past 15 years, i.e., during the Great Recession in 2009. See the nearby graph.
- Overall occupancies posted a net gain of 12.1 million sq. ft. led by industrial (12.2 million sq. ft.) and retail (5.2 million sq. ft.). The industrial gains were the greatest since the 23.5 million sq. ft. increase during Q3 2018 and were boosted by an uptick in transportation, warehousing and manufacturing employment at year end. In fact, the strong industrial demand bent the curve downward on the Q4 average national industrial vacancy rate (3.7%, down 10 bps) as well as the overall availability rate (5.4%, down 20 bps).
- Job gains in retail trade also helped to stabilize retail space fundamentals. The average vacancy rate of 4.6% was unchanged, and total availabilities declined 10 bps to 6.1% as retail employment has recovered 2.0 of the 2.4 million jobs lost last spring.
- The struggling office sector suffered another setback with net occupancy losses of 5.2 million sq. ft., extending the decline to four quarters and culminating in a total net occupancy loss of 31.7 million sq. ft. for the full year – the biggest annual deficit since at least 2006. Though professional and business services employment rose in December for the eighth month in a row, the greater countervailing trend is the predominance – and success – of the work-from-home option. To underscore the prevailing utility of remote work – and uncertain outlook for this sector – sublease space among small office buildings rose more than 50% YOY to 12.5 million sq. ft. nationally, with the average 0.3% sublet vacancy representing the highest rate since 2009. Also, when sublease is combined with direct space for lease, the total office availability rate, at 9.6%, is the highest in four years. Nationally, the office sector is clearly shaping up to be the laggard, behind retail, in leasing velocity.
Price Trends
Small-cap CRE price growth has slowed during the COVID crisis but is still trending up as distressed assets continue to be a no-show in the marketplace. Boxwood’s most recent National Small Commercial Price Index (SCPI) results covering 160 markets include:
×
![]()
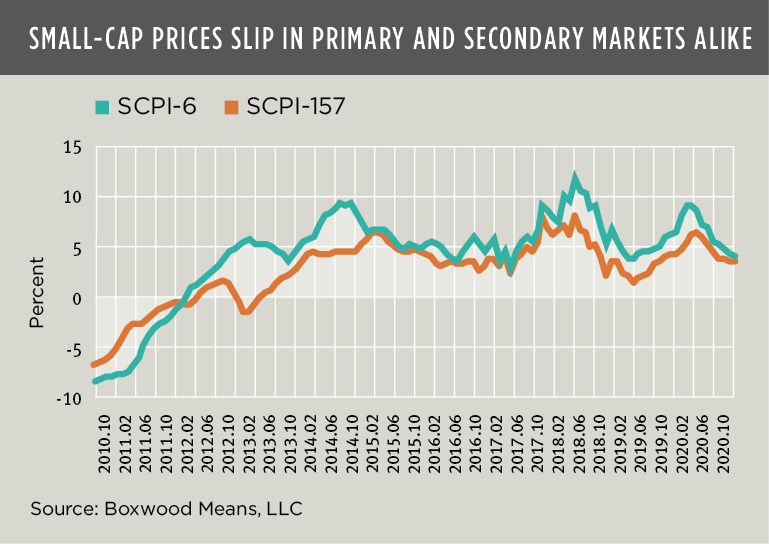
- The National SCPI Index grew 2.6% YTD through October and 3.6% YOY. With low sales volume and an abundance of market uncertainty, the 12-month return is the lowest annual figure in more than a year and declined for the seventh month in a row.
- Price gains for the SCPI-6 collection that represents the six largest U.S. population centers has also tightened for nine consecutive months to 3.9% YOY and the lowest annual growth rate since early 2019. A similar pattern prevails for the balance of markets (i.e., secondary and tertiary metros), with annual price growth for SCPI-157 having narrowed to 3.4%. See the nearby graph.
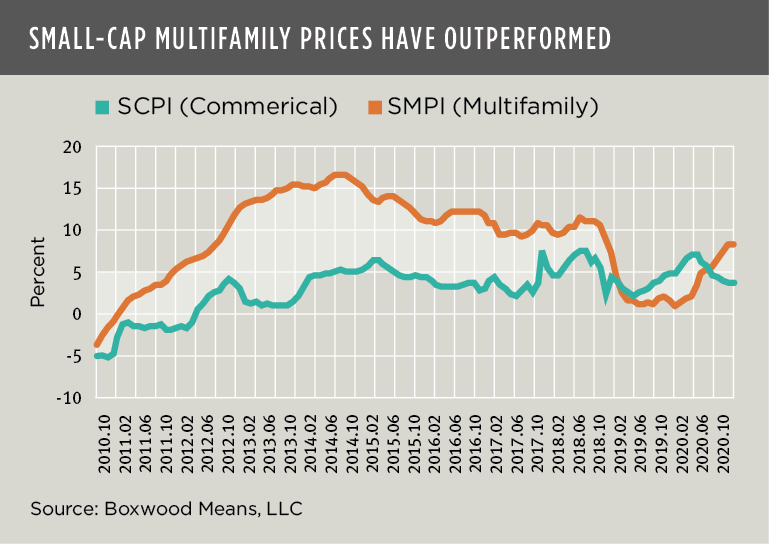
- Small-cap multifamily prices remain buoyant, supported by supply shortages of affordable housing, cheap capital, and relatively low investment risk. Boxwood’s National Small Multifamily Price Index (SMPI) for 100 markets was unchanged at an annual growth rate of 8.2%, up from 1.5% last October and the highest level in two years. See the comparison chart nearby.
All in all, the small-cap CRE space and investment markets have proven to be surprisingly resilient. That said, COVID cases and deaths are soaring since the 2020 holiday season and, coupled with the tardy rollout of the vaccine to date, it’s anybody’s guess what the trajectory of Main Street economic recovery and growth will look like in the immediate months ahead, and as the new administration in Washington, DC gets to work.

 Randy Fuchs