The commercial real estate press is full of gloomy statistics describing current investment market conditions. CBRE reported a 57% decline in property sales in Q1. The Greenstreet CPPI charted a 16% decline in prices since the March 2022 peak. MSCI/RCA’s data showed an 11.2% drop over the past year. These data track general expectations within the industry. And why not? Interest rates are sky-high --- or at least much higher than a couple of years ago --- sellers are mostly sitting on the sidelines, and lenders are scouring the land for what few deals may pop up. Indeed, Boxwood’s research indicates that small commercial property transactions have declined by roughly 47% YOY among the top 20 markets. Falling prices, reduced volume, and high interest rates --- seems like everything is lining up to produce a train wreck for CRE by year’s end.
Enter Boxwood’s Small Commercial Price Index (SCPI) which upends this (rather depressing) narrative. Through April, SCPI posted a 3.4% gain YOY in the top 20 markets and 4.6% in the top 100 metros. In fact, even as deal volume has plummeted and other CRE price indices detail steep drops, SCPI continues to march upward rather slowly at the national level and in many of the markets that we cover. In other words, though there are only half as many deals being closed, small cap CRE asset prices have remained steady in aggregate.
There are two basic reasons for the discrepancy between Boxwood’s SCPI and other price indices: (1) Differences in the CRE market domain being tracked; and (2) What the various indices are actually measuring.
Concerning market coverage, for example, Green Street says of its CPPI, “Features that differentiate this index are its timeliness, its emphasis on high-quality properties, and its ability to capture changes in the aggregate value of the commercial property.” On the other hand, RCA tracks properties principally above $2.5 million in value and only includes transactions involving repeat sales. Boxwood’s SCPI metric focuses exclusively on small deals under $5 million, and importantly, we capture all transactionsi. In the top 20 markets, e.g., 60.1% of the total number of properties we cover traded hands for less than $1 million in 2022. These under-a-million properties, however, only comprised about 17% of the total dollar volume of last year’s transactions.
Boxwood’s price indices target the extensive market of small commercial transactions. As such, tracking average (mean) price changes would dramatically underweight the 60% of transactions that accounted for only 17% of the total dollars transacted. Instead, we track median price changes that more accurately reflect the bulk of the transactions in the market. Of course, the choice of tracking median or mean is irrelevant if the entire market basket of asset sales is moving in tandem, but this is clearly not the case today.
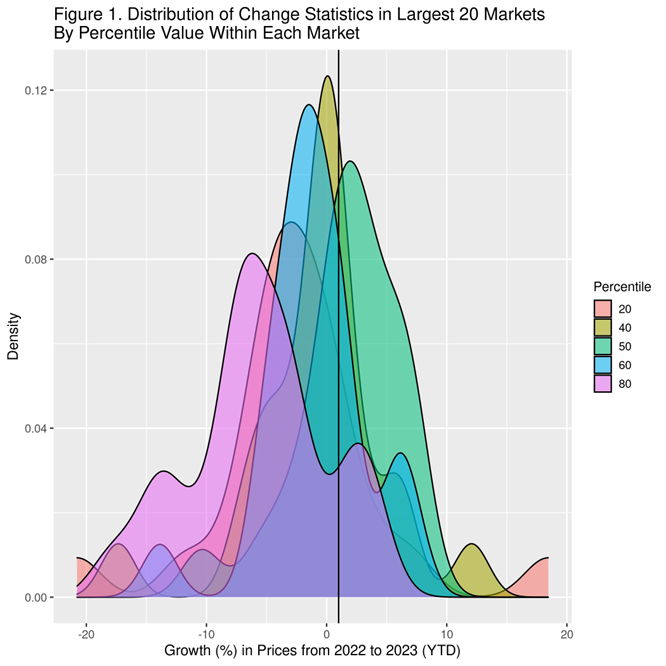
Through April of this year, the mean price of small commercial properties fell roughly 3% in the top 20 markets in aggregate, while the median market price increased by about 3%ii. This 6-point differential begs the question: What is behind this variance? To find out, we collected all of the sales transactions in each of the top 20 markets and stratified them by price levels. We then recorded the price of each quintile in the distribution of prices. This allowed us to see how prices are distributed in each market from the lowest priced properties (20th percentile), the median (50th percentile), and the highest (80th percentile) as well as points in between. The distribution of these prices for the top 20 markets in aggregate is shown in Figure 1.
×
![]()
Figure 1 shows that with very slight differences asset prices for the mid-priced properties (40, 50, and 60th percentiles) tend to clump around a zero change in values between 2022 and the first four months of 2023. However, of note the most expensive properties lean much more heavily to the left side of the graph indicating a more substantial 6% decrease in prices. (The least costly properties show a similar weakening pattern though by half as much, down 3%.) The fact that the high-priced small cap CRE sales, represented by the 80th percentile, show the greatest decline in values suggests that the price performance among this group of assets more closely mirrors the sloping price trajectory of larger properties tracked by the other industry indices.
Yet the bulk of the transactions that occur in the middle of the price distribution enjoy price stability. The more expensive sales pushed the mean prices down while leaving median prices substantially unaffected. This explains the relative constancy of the small cap CRE domain compared with the larger market.
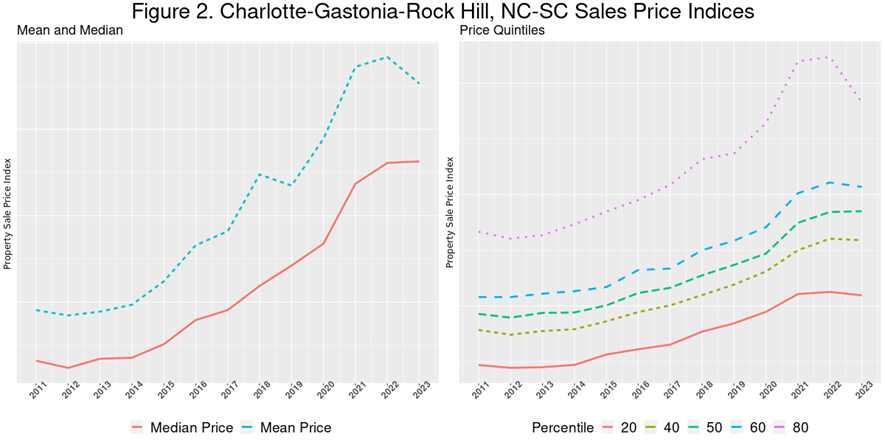
For a more refined perspective, we display the mean and median price trajectories along with the quintiles for a number of metros below.
For instance, Charlotte illustrates this split behavior with median prices rising slightly so far this year while mean prices have declined substantially (left graph). The right-most graph in Figure 2 shows that values for the higher-priced properties price have fallen sharply with smaller declines at the 60th and 20th percentile. Median prices (50 and 40th percentiles) increase slightly.
×
![]()
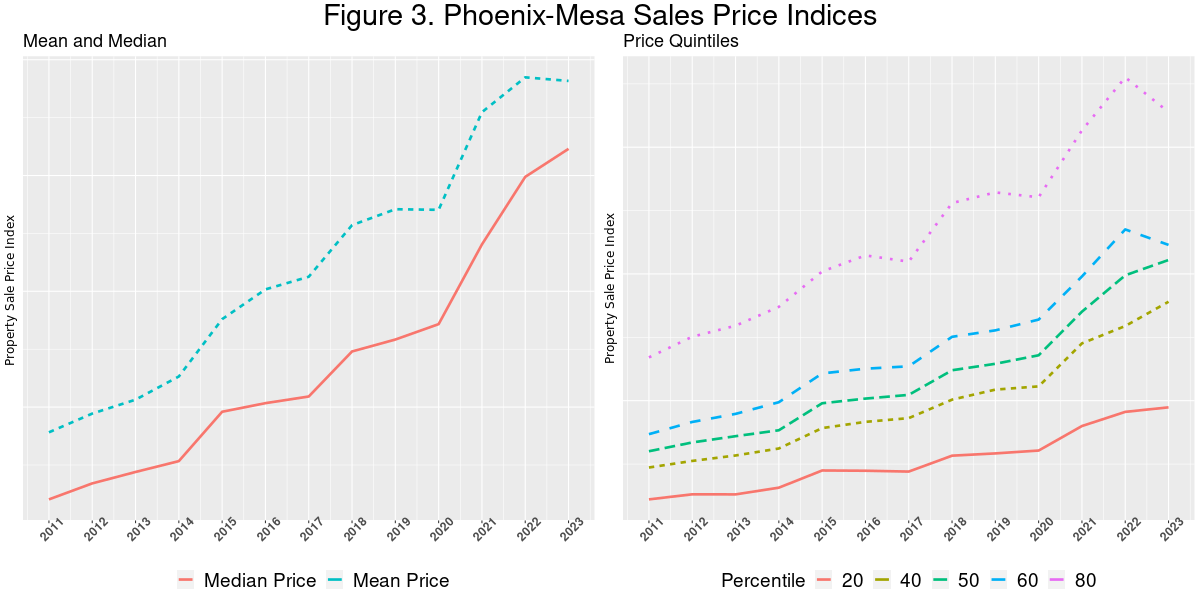
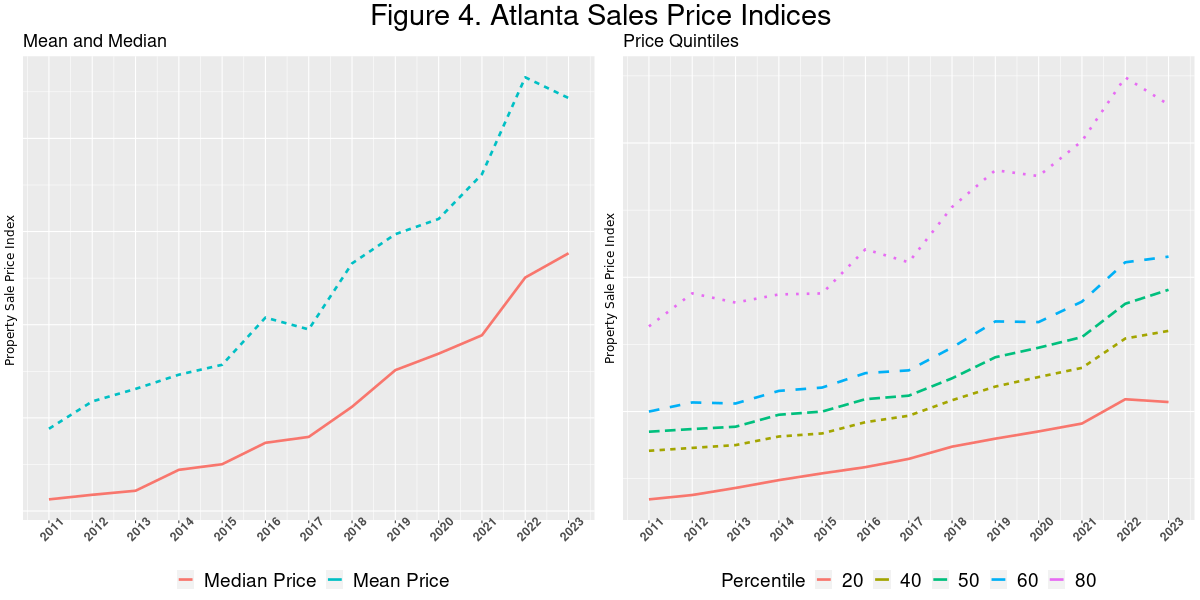
Similar stories are true for Phoenix and Atlanta as shown in Figures 3 and 4 further belowiii.
So, which measure is correct? Are prices falling or (slightly) rising? By design, Boxwood’s SCPI tracks all transactions and clearly indicates stable prices for most property sales even as the number of transactions remains low. Other price indices cited above are more heavily weighted towards more expensive properties, properties with repeat sales, and /or are weighted by price. (mean versus median).
In sum, Boxwood’s SCPI most accurately describes price changes of properties selling under $5 million, most of which sell for less than $1 million. As such, we are confident that both nationally and across most individual metro areas the small cap commercial property market to date has dodged the plunging asset values reported elsewhere and remains relatively stable. The one caveat to this conclusion is that, as observed above, small cap properties at the higher end of the price spectrum exhibited substantial declines. In other words, it appears in general that the biggest properties are perceived by buyers as riskier in this market environment and demand heavier price discounts.
×
![]()
×
![]()

 Michaell Taylor